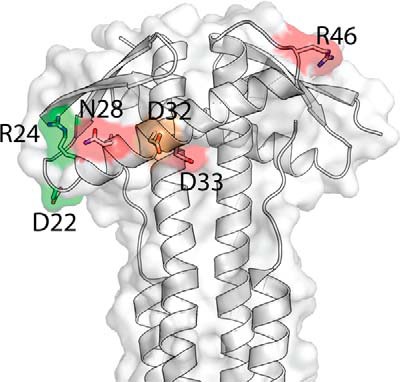
FIGURE 5.

Mutant phenotypes mapped onto the EcZapA structure. Orientation as in Fig. 1C, but here colored according to the effect of point mutations at each residue. Residues in green have a relatively weak (though measurable) effect on the EC50 (EC50 < 5 μm), the number of filaments per bundle (>7) and the cell length (<3 μm). Residues highlighted in red, in contrast, have strong effects on the EC50 (EC50 > 5 μm), the number of filaments per bundle (<7), and the cell length (>3 μm). The residue highlighted in orange has a weak affect on the EC50 (EC50 <5) but nevertheless strongly affects both the number of filaments per bundle (<7) and the cell length (>3 μm).
