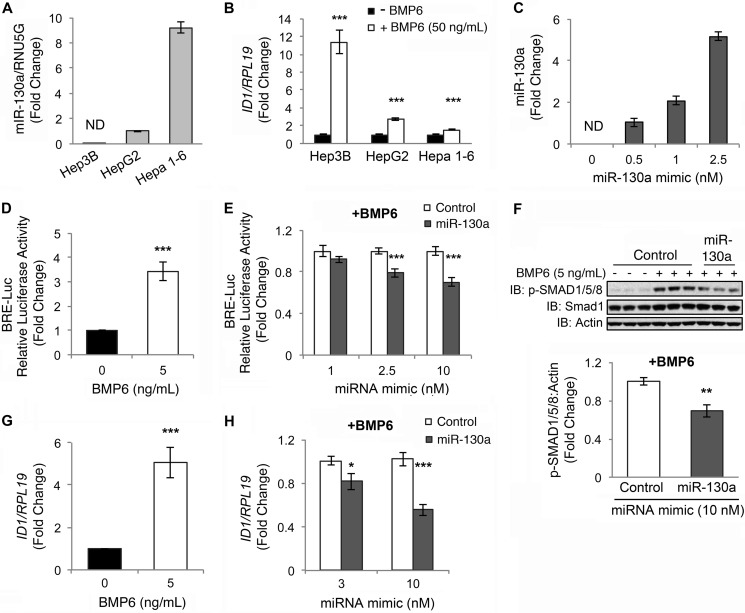
FIGURE 2.
miR-130a inhibits BMP6-SMAD signaling in hepatoma-derived cells. A, endogenous miR-130a levels relative to the small RNA RNU5G were quantified by qRT-PCR in hepatoma-derived Hep3B, HepG2, and Hepa 1–6 cells. Data are reported as the mean fold change ± S.E. relative to HepG2 cells; ND indicates not detectable. B, Hep3B, HepG2, and Hepa 1–6 cells were treated for 17 h without (black bars) or with 50 ng/ml BMP6 (white bars), followed by measurement of ID1 relative to RPL19 mRNA by qRT-PCR. Results are reported as mean ± S.E. of the fold change from untreated cells. C, Hep3B cells were transfected with increasing concentrations of miR-130a mimic and treated with 5 ng/ml BMP6 for 17 h, followed by measurement of miR-130a levels by qRT-PCR. Results are reported as the mean fold change ± S.E. relative to 0.5 nm miR-130a treated cells. D and G, Hep3B cells were transfected with BRE-Luc and control Renilla luciferase vector (D) or mock-transfected (G) and were treated without (black bar) or with 5 ng/ml BMP6 (white bar) for 17 h, followed by measurement of relative luciferase activity (D) or ID1 relative to RPL19 mRNA by qRT-PCR (G). Results are reported as mean ± S.E. of the fold change from untreated cells. E, Hep3B cells were transfected with BRE-Luc and a control Renilla luciferase vector in combination with increasing concentrations of miR-130a (gray bars) or negative control mimic (white bars) and were treated with 5 ng/ml BMP6 for 17 h, followed by measurement of relative luciferase activity. Results are reported as the mean fold change ± S.E. relative to the negative control at each concentration. F and H, Hep3B cells were transfected with miR-130a (gray bars) or negative control mimic (white bars) and were treated without or with 5 ng/ml BMP6 for 17 h, followed by measurement of phosphorylated SMAD1/5/8 (p-SMAD1/5/8) and total SMAD1 relative to actin by immunoblot (IB) and chemiluminescence quantification (F) or ID1 relative to RPL19 mRNA by qRT-PCR (H). Results are reported as the mean fold change ± S.E. relative to control at each concentration. A, results are shown for two experiments, each performed in triplicate. C, results are shown from one of two experiments performed in triplicate. For all other panels, n = 3–4 experiments, each performed in duplicate (for some immunoblots) or triplicate (for all other experiments); *, p < 0.05; **, p < 0.01; ***, p < 0.001. A representative immunoblot is shown.

