FIGURE 3.
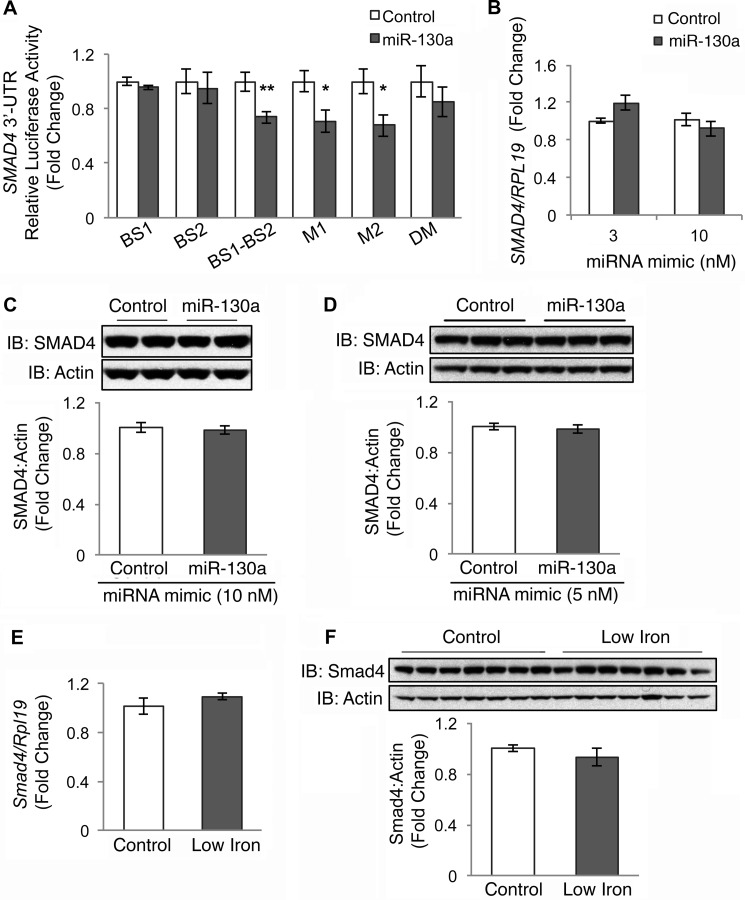
miR-130a mimic does not target the 3′UTR of SMAD4. A, SMAD4 3′UTR relative luciferase activity was measured by Dual-Luciferase assay in Hep3B cells transfected with 10 nm miR-130a (gray bars) or negative control mimic (white bars), in combination with control Renilla luciferase reporter and an engineered SMAD4 3′UTR firefly luciferase construct containing the proximal miR-130a binding site (BS1), the distal binding site (BS2), the two predicted miR-130a-binding sites cloned side-by-side (BS1-BS2), or a BS1-BS2 construct with mutations in the proximal (M1), distal (M2), or both predicted binding sites (DM). B–D, Hep3B (B and C) or HEK293 (D) cells were transfected with the indicated concentration of miR-130a (gray bars) or negative control mimic (white bars) and were treated for 17 h with 5 ng/ml BMP6, followed by measurement of SMAD4 relative to RPL19 mRNA by qRT-PCR (B) or SMAD4 relative to actin protein by immunoblot and chemiluminescence quantitation (C and D). A–D, results are reported as the mean fold change ± S.E. relative to negative control; n = 3–5 experiments, each performed in duplicate (C) or triplicate (A, B, and D). Representative immunoblots are shown. E and F, liver tissue from mice treated with a control (Control) or a low iron diet (Low Iron) as described in Fig. 1, B–D, were analyzed for Smad4 relative to Rpl19 mRNA (E) and Smad4 relative to actin protein expression by immunoblot and chemiluminescence quantification (F). Results are reported as the mean fold change ± S.E. relative to the control group. For all panels, significance is indicated by *, p < 0.05; **, p < 0.01.

