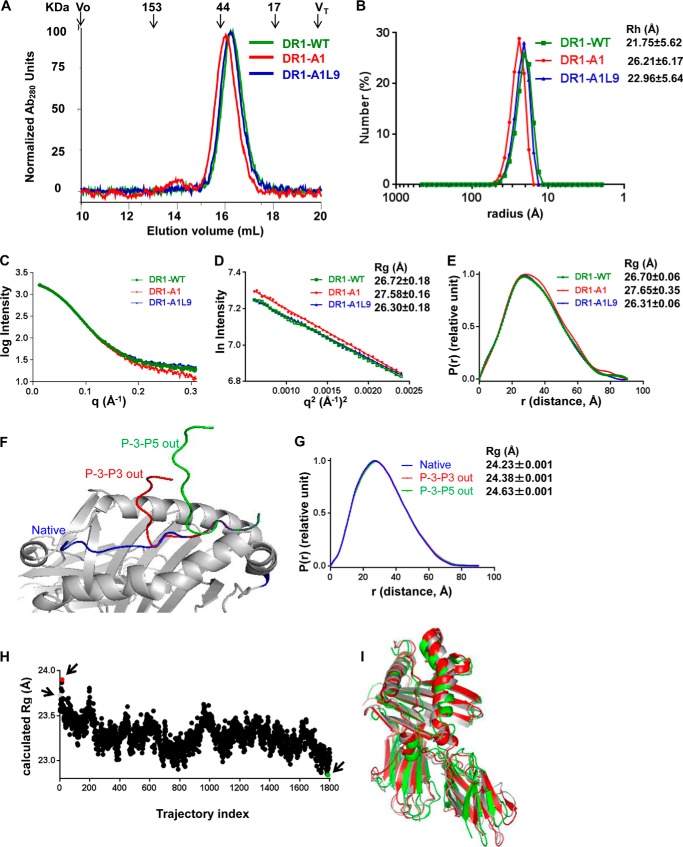
FIGURE 7.
DR1-A1 shows altered hydrodynamic behavior and increased radius of gyration. A, gel filtration of DR1-WT, DR1-A1L9, and DR1-A1. The elution position and molecular mass of protein standards are shown above traces, with void volume (Vo) and total included volume (VT) indicated. These traces are representative of at least 20 independent experiments. B, dynamic light scattering measurement for DR1-WT, DR1-A1L9, and DR1-A1. The hydrodynamic radius (Rh) of each complex is indicated. Each sample was run for 13–20 times. C, SAXS profiles of DR1-WT, DR1-A1L9, and DR1-A1. The y axis is log of the scattering intensity, and the x axis is the scattering vector (q). The reciprocal of q can be interpreted as the resolution with which the sample is observed. D, Guinier plot of the SAXS profiles, with Rg indicated for each complex. E, P(r) (pair-distance distribution function) of the SAXS profiles, with Rg indicated. F, graphic presentation of the native DR1-A1L9 structure (blue), same structure with conformation of peptide adjusted at the P4 residue so that P-3-P3 are out of the binding site (red), and the same structure was adjusted at the P6 residue so that P-3-P5 are out of the binding site (green). G, P(r) function of the SAXS profiles theoretically calculated from the coordinates, with Rg indicated. H, Rg of each of 1800 conformations from molecular dynamic simulation trajectory is plotted. The molecular dynamic simulation was done previously for DR1 bound with a HIV-1 gag peptide (PDB code 1SJE). The Rg for the start model (trajectory 1, gray), model with largest Rg (trajectory index 15, red), and model with smallest Rg (trajectory index 1788, green) are indicated by arrows in the plot. I, overlapping view of the start model (gray), model with largest Rg (red), and model with smallest Rg (green).

