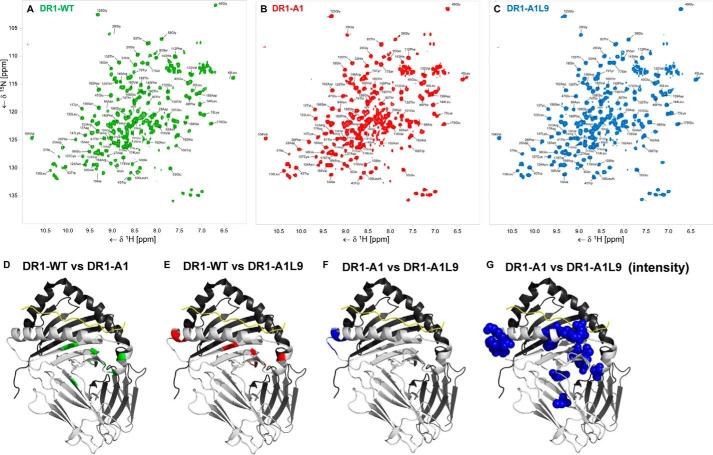
FIGURE 8.
NMR spectroscopy reveals conformational differences between DR1-WT, DR1-A1L9, and DR1-A1. NMR spectra of DR1-WT (green) (A), DR1-A1 (red) (B), and DR1-A1L9 (blue) (C) with assigned residues indicated. Significant NMR chemical shift differences of DR1-WT versus DR1-A1 highlighted in green (Ala-10, Glu-11, Asp-25, Phe-26, Asp-27, Gly-28, Ile-31, Trp-43, Leu-45, Gly-49, and Lys-147) (D), DR1-WT versus DR1-A1L9 highlighted in red (Ala-10, Glu-11, Asp-25, Gly-28, Asp-29, Ile-31, Trp-43, Gly-49, Thr-74, Lys-75, Ser-77) (E), and DR1-A1 versus DR1-A1L9 highlighted in blue (Thr-74, Lys-75, Ser-77, Tyr-79, and Thr- 80) (F) are mapped onto the structure of DR1-A1L9. The 15N-labeled α-subunit is shown in light gray and the β-subunit in black in the schematic. G, significant signal-to-noise differences between DR1-A1 versus DR1-A19L are represented as blue spheres.

