FIGURE 10.
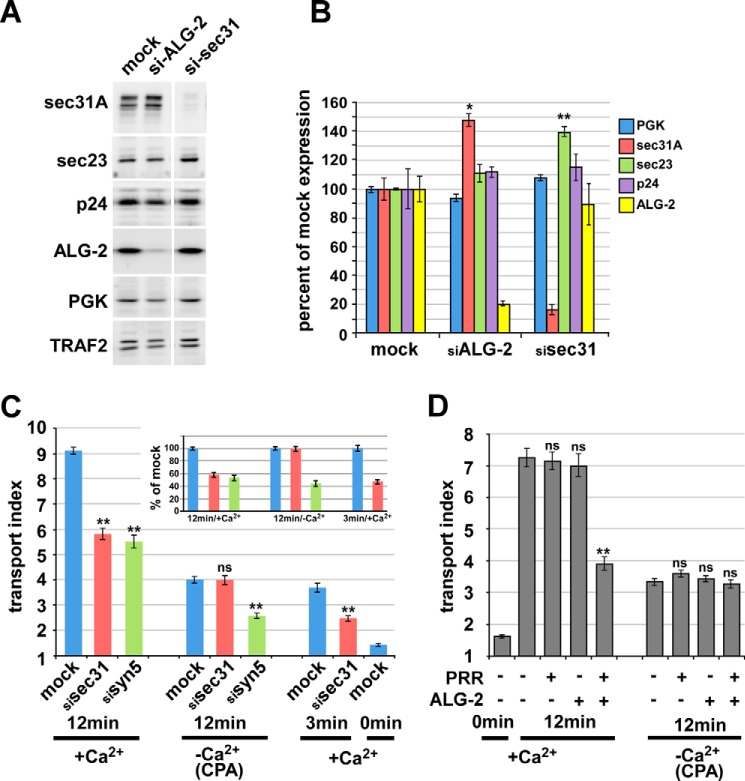
Sec31A function in transport and modulation of transport by ALG-2/Sec31A interactions require luminal Ca2+. A, knockdown of ALG-2 and Sec31A by siRNA. Western blotting of treated cell extracts with the indicated antibodies demonstrates specificity of the depletions. B, quantitation of replicate samples and Western blots as in A, displaying relative amounts of the five indicated proteins in mock- or siRNA-treated samples. To compare and combine band intensities from multiple samples, each protein amount was normalized to the amount of the constitutively expressed cytosolic protein, TRAF2, in the same lane and then expressed relative to the mean normalized value obtained in mock-treated samples. C, ER-to-Golgi transport of VSV-G-GFP following siRNA and/or CPA treatment as indicated. siRNA-treated or mock-treated cells were transfected with VSV-G-GFP and incubated overnight at 40 °C. After ∼24 h, cells were either left in control medium (+Ca2+) or treated with CPA at 40 °C as in Fig. 1 (−Ca2+/CPA) and then shifted to 32 °C for the indicated times. Cells were then fixed, and the arrival of VSV-G-GFP in the Golgi area was quantified using the transport index algorithm. Each bar represents the mean of ≥90 cells from three independent experiments that were averaged for the graph. The inset shows the 12- and 3-min groups' transport indices, normalized such that their own mock-treated value equals 100%. D, ER-to-Golgi transport of VSV-G-GFP upon overexpression of the ALG-2 and Sec31A-PRR inhibitor constructs and/or CPA treatment. NRK cells were transfected with VSV-G-GFP along with no additional construct, ALG-2 wild type, and/or a FLAG-Sec31-PRR construct consisting of residues 800–1113, as indicated, and held at 40 °C. After ∼24 h, cells were either left in control medium or treated with CPA at 40 °C as in Fig. 1 and then shifted to 32 °C for the indicated times. Cells were then fixed and immunolabeled to identify which cells expressed the constructs, and the arrival of total VSV-G-GFP in the Golgi area was quantified using the transport index algorithm. Each bar represents ≥90 cells from three independent experiments that were averaged for the graph. Asterisks, p values for two-tailed t tests for the indicated value versus its corresponding mock-treated value. *, p < 0.05; **, p < 0.01 (B) or p < 10−8 (C and D); ns, p > 0.05. Error bars, S.E.

