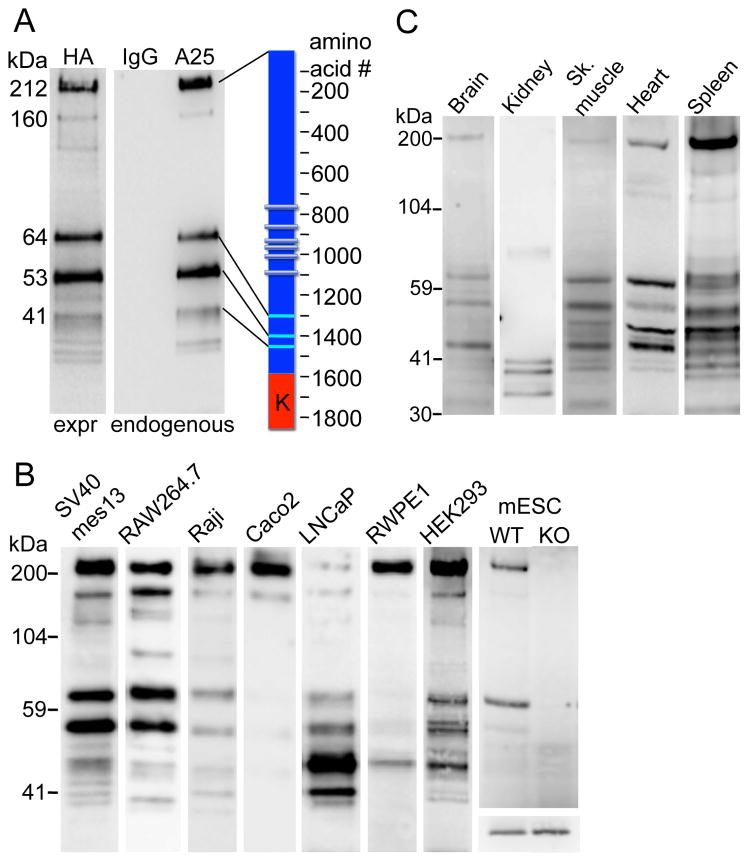
Figure 1. TRPM7 cleavage fragments identified in multiple cell lines and tissues.
A. TRPM7 protein cleavage fragments in mouse mesangial SV40 mes13 cells. Cells were extracted with TBS/1% NP40. Endogenous TRPM7 was immunoprecipitated (IP’d) from lysates with TRPM7 C-terminal mouse monoclonal antibody (αA25) or normal mouse IgG and probed on WB with anti-C-terminal rabbit antibody (αC47). C-terminally HA-tagged TRPM7 (expressed=expr) was IP’d with anti-HA-agarose (αHA) from SV40 mes13 cells stably expressing recombinant protein and probed on WB with αHA-peroxidase conjugate. Scale (left) indicates the molecular weight of major bands calculated from their electrophoretic mobility relative to standard molecular weight markers. Cartoon (right) shows the approximate position of cleavage sites; K indicates kinase domain.
B. TRPM7 cleavage pattern in 8 distinct cell lines. Mouse mesangial (SV40 mes13), macrophage (RAW 264.7), mESC, human B-lymphocyte (Raji), Caco-2 (colon epithelial), prostate (metastatic LNCaP and non-metastatic RWPE1), and embryonic kidney (HEK-293) cells were extracted and IP’d as described in A. Extracts demonstrate the relative amounts of cleaved TRPM7 isolated from each tissue. Information about the relative content of the full length TRPM7 and the cleaved fragments is contained in each individual lane, which are intentionally not normalized to control protein. No positive bands were found from the same tissue extracts IP’d with normal mouse IgG (not shown). mESCs were generated as described in Experimental Procedures from WT or TrpM7−/− (KO) blastocysts. The lower panel in the mESC column shows equal actin content in both mESC lysates. Samples run on different gels are combined in the figure and aligned against identical molecular weight markers.
C. TRPM7 cleavage pattern in different mouse tissues. Freshly isolated mouse organs were extracted and IP’d as described in A. Extracts demonstrate the relative amounts of cleaved TRPM7 isolated from in each tissue. No positive bands were found from the same tissue extracts IP’d with normal mouse IgG (not shown).

