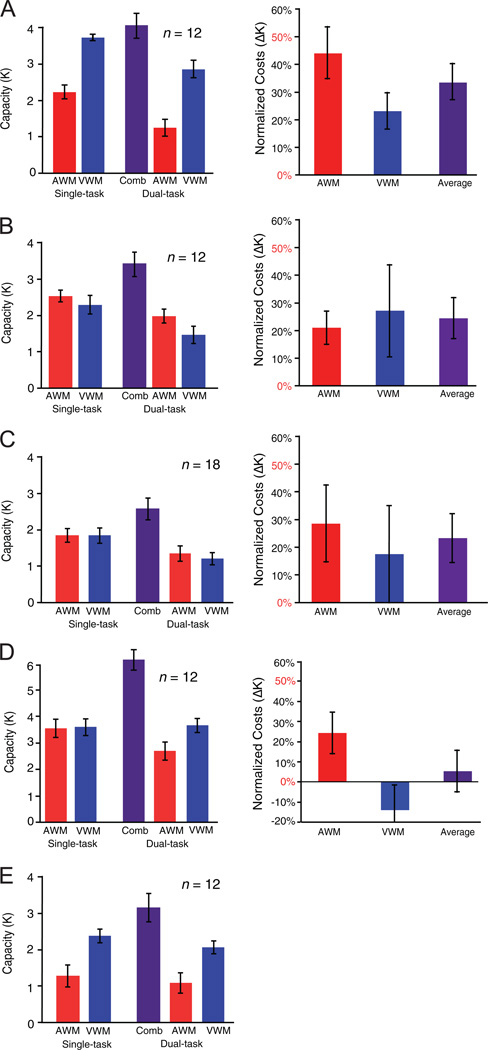
Figure 2 (opposite).
Left column of A-E: Working memory (WM) capacity for auditory WM (AWM, red) and visual WM (VWM, blue) tasks as a function of single-task or dual-task (DT) conditions for Experiments 1, 2A, 2B, 3A, and 3B, respectively). The combined (Comb; purple) DT capacity was calculated by summing each participant’s auditory and visual DT WM capacity. Right column of A-E: Normalized DT costs (ΔK) for the AWM (red) task and the VWM (blue) task and the average of these two costs (purple). A normalized cost of 50% would represent no intermodal savings, whereas 0% indicates no interference across modalities. Note that the normalized cost is inappropriate for Experiment 3B because single-task AWM was near chance level. Error bars represent the standard error of the mean.

