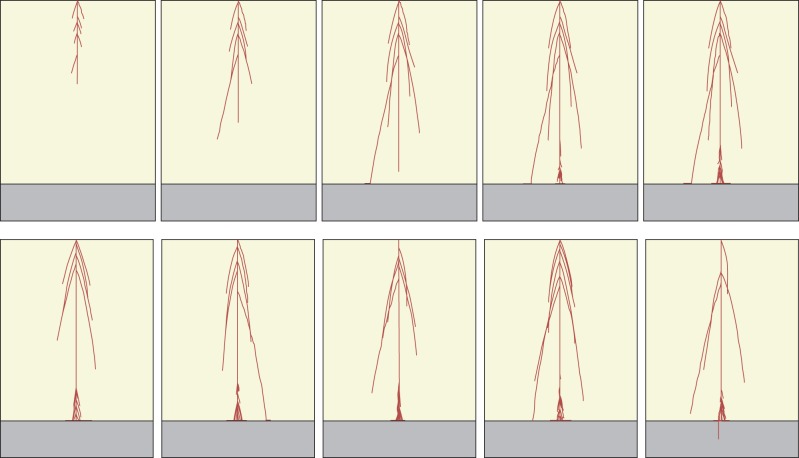
Fig. 2.
Phenotypic root structure realizations of the single TARSIERS genotype that was used as the starting point to generate the initial population for each of the four evolutionary runs. The top row shows selected ‘snapshots’ from a time series of one realization of a root structure generated from this genotype developing over the full wet season growing period (after day 36, 72, 108, 144 and 180, respectively). The bottom row shows different phenotypic root structure realizations generated from the same genotype, all at the end of the growing period only (day 180). Note that one single genotype can produce different phenotypes; in these examples, just one of the six illustrated phenotypic realizations of the one genotype has successfully found a wet crack (the final one at bottom right). Soil depth is 25 cm in all cases.

