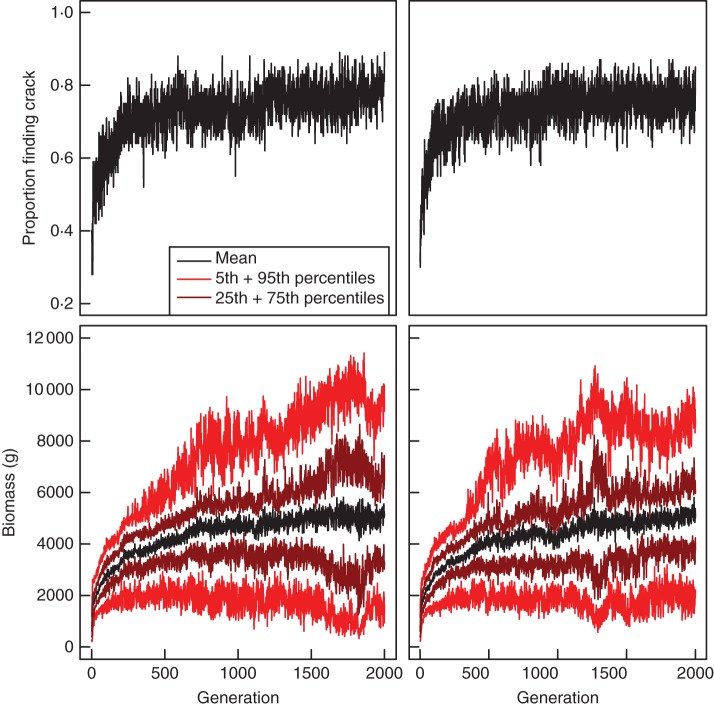
Fig. 4.
Mean relative reproductive success or fitness over 2000 generations for the Crack Scenario (top) and Biomass Scenario (bottom) for two evolutionary runs (left and right). For the Biomass Scenarios, the 5th and 95th, and 25th and 75th percentiles are shown in addition to the mean (see key) to give an indication of variability within populations. Similar indications of variability within populations were not informative for the Crack Scenario as the recorded measure was binary (a given individual either found a crack, or did not), and both outcomes occurred in every single generation.

