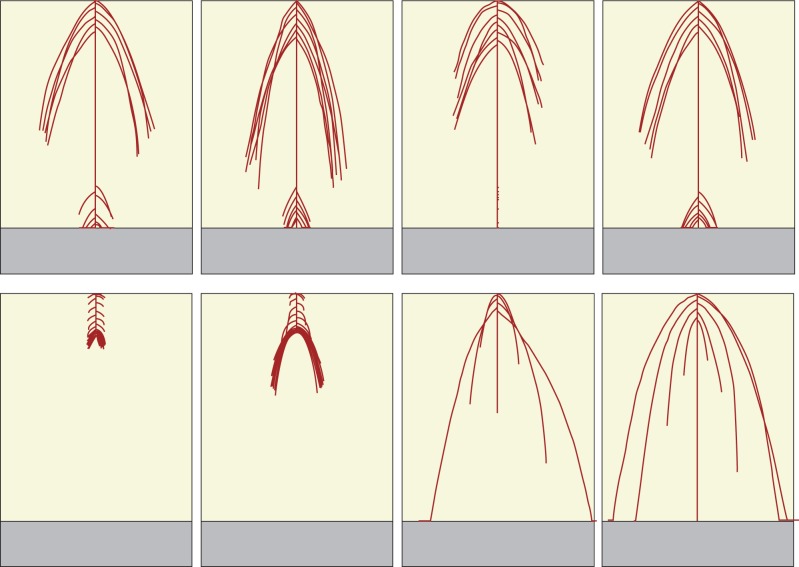
Fig. 6.
Realized phenotypes of genotypes selected from the final population of 100 individual plants from the first Biomass Scenario evolutionary run, based on additional testing of the final population. The top row shows realized phenotypes from the four most successful genotypes under the additional testing; each achieved a mean final shoot biomass of >7750 g over 100 phenotypic realizations (specifically 7750, 7770, 8773 and 8882 g from left to right). Note that the laterals at the bottom of the profile here are much shorter than those in Fig. 4. The bottom row shows realized phenotypes from four of the least successful genotypes under the additional testing; each achieved a mean final shoot biomass of >4800 g over 100 phenotypic realizations. Soil depth is 25 cm in all cases.

