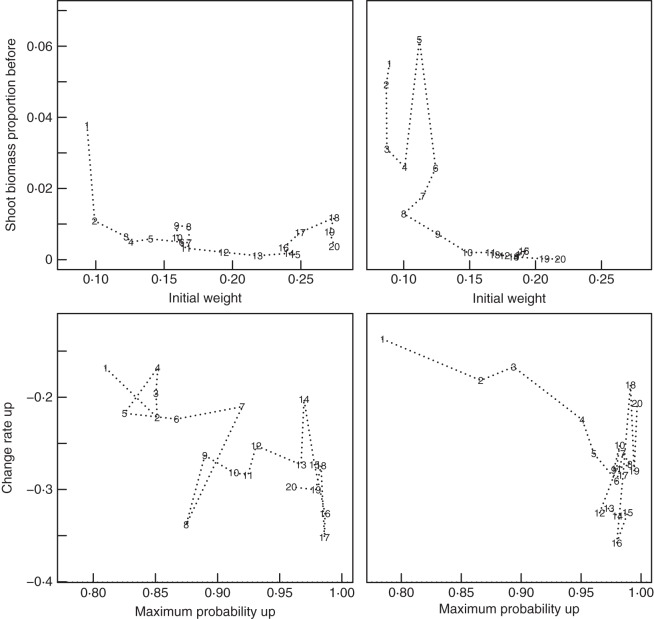
Fig. 8.
Two-dimensional representation of how selected strategy parameters covary over generations for the first Crack Scenario run (left) and the second Crack Scenario run (right). The proportion of biomass allocated to shoot before a wet crack is encountered, pshbmb, is plotted against the initial growth weighting of the lateral roots, wt0 (top), and the rate of change of the probability of branching moving up the main root following its first encounter with the impermeable surface, aup, is plotted against the maximum probability of branching moving up the main root following its first encounter with the impermeable surface pupmax (bottom). Points represent the average value of the parameter over a 100 generation period (1, first 100 generations; 2, second 100 generations, etc.). For the top sub-plots, note how the trajectory seems to ‘get stuck’ between approximately the 600th and 1100th generations and again between the 1400th and 1600th generations in the first run, while in the second run it similarly stalls between the 1100th and 1800th generations and temporality regresses towards initial values around the 500th generation. Nonetheless, the two trajectories follow generally similar paths, although the second is lagging behind the first by a few hundred generations. Similar patterns, differences and overall similarities can be observed in the lower sub-plots, although there is more indication that evolution has stabilized by the 2000th generation, in the sense that parameter values are not changing as fast or as systematically as in earlier generations.

