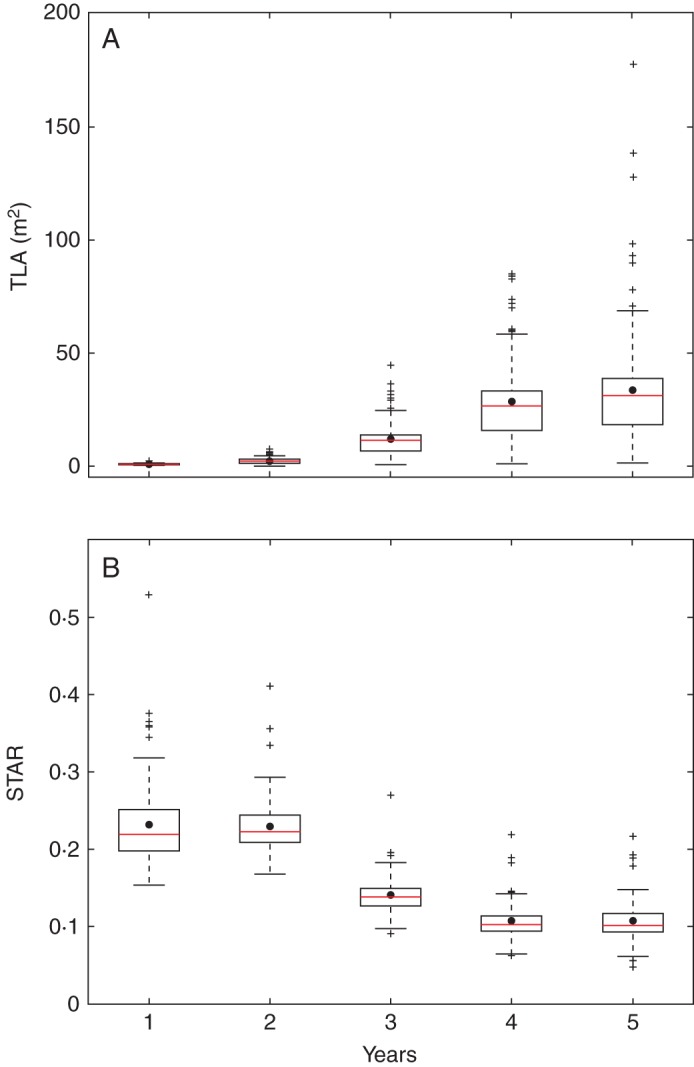
Fig. 4.

Evolution of TLA (total leaf area) and silhouette to total area ratio (STAR) for 108 simulated trees from the second to fifth year of growth in the topology experiment, when varying the branching sequences of trunk first annual shoots. Each box extends from the lower to upper quartile values, with a red line at the median and a dot at the mean values, respectively.
