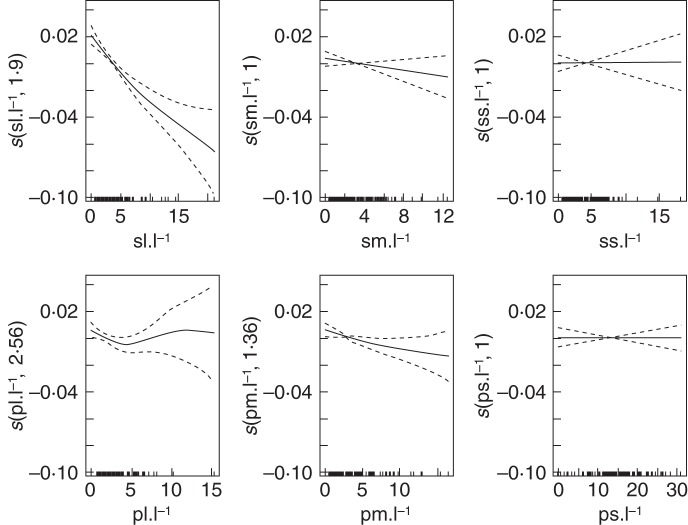
Fig. 7.
Expected mean values (solid lines) and confidence band (dashed lines) of smoothed terms (y-axes: predicted STAR value) depending on the input parameter values in the topology experiment, with a decomposition of lateral types into length categories (x-axes: position of sampled values) estimated from the generalized additive model (GAM). The term s in the labels on the y-axes indicates that thin -plate splines are used, and the number corresponds to the equivalent degree of freedom (e.d.f.) of the estimated curve.

