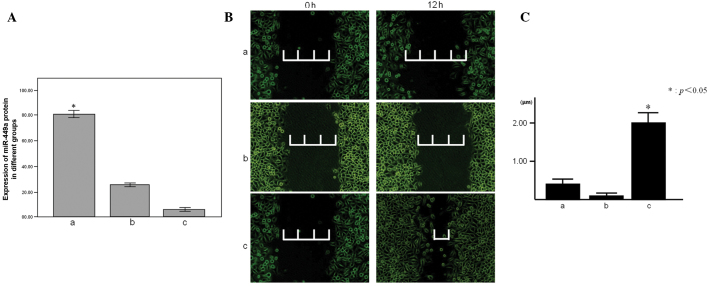
Figure 2.
(A) Relative expression of the miR-449a. ‘a’ represents the miR-449a upregulation group; relative expression, 81.844±5.095, P<0.001. ‘b’ represents the control group; relative expression, 26.233±2.011. ‘c’ represents the miR-449a downregulation group; relative expression, 6.733±1.575. Relative expression is measured as a percentage and *P<0.05. (B) The experimental result of the scratch test (x100). (C) ‘a’ represents the miR-449a upregulation group; distance change between edges of scratch, 0.503±0.080. ‘b’ represents the control group; distance change between edges of scratch, 0.198±0.068. ‘c’ represents the miR-449a downregulation group; distance change between edges of scratch, 2.519±0.350, P<0.001. The unit is of measurement is μm and *P<0.05. miR, microRNA.

