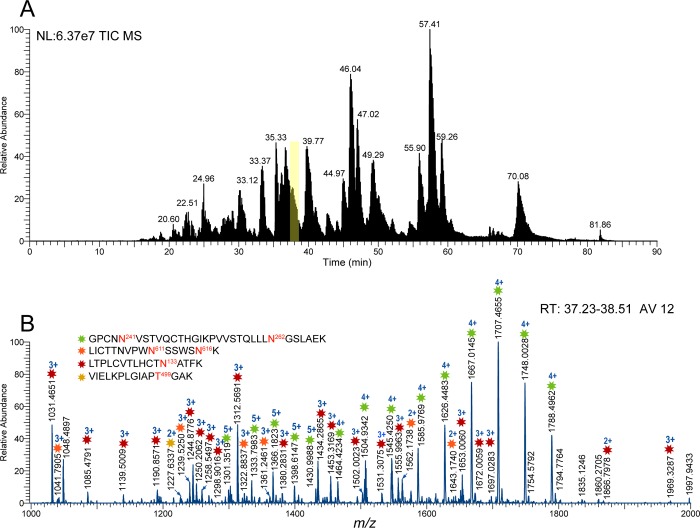
Figure 5.
(A) Total ion chromatogram (TIC) and (B) ESI–FTICR–MS data of tryptic digest of stably expressed C97ZA012 gp140. The mass spectrum averaged within 37.23–38.51 min shows elution of four glycopeptide species. Asterisks (*) in the MS data denotes glycopeptide peaks. Glycan compositions of each observed glycopeptide peak in the mass spectra were verified from CID and ETD data.

