
Figure 7.
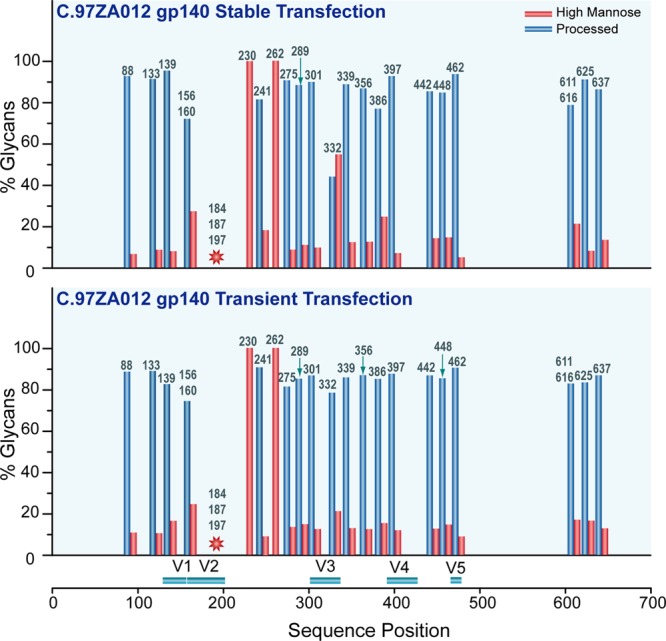
Bar graph showing the glycan profiles at each identified glycosylation site of the stably and transiently expressed C97ZA012 gp140. The glycan compositions (in percent) were broadly categorized into two classes: high-mannose (red bar) and processed glycans (blue bar). Red asterisk means that the glycan composition on these sites was not fully characterized.