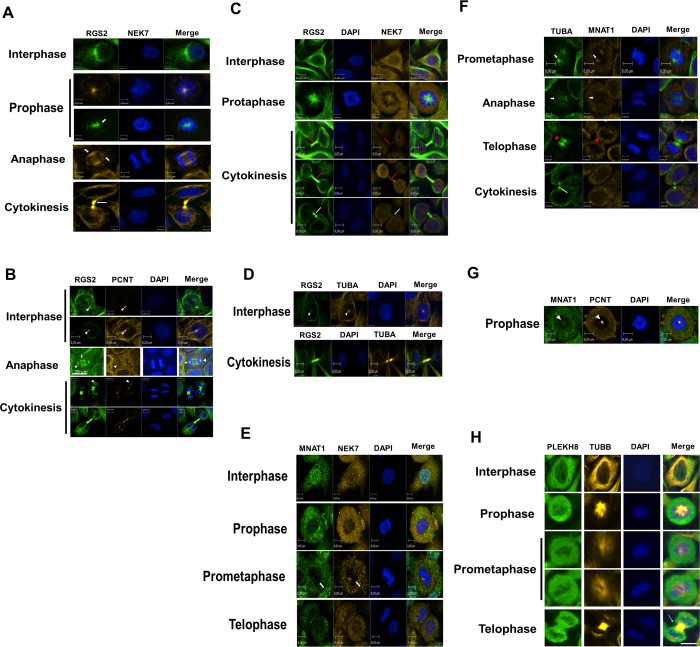
Figure 4.
Subcelullar localization in HeLa cells of NEK7, RGS2, MNAT1, PLEKH8, TUBA (α-tubulin), and PCNT (Pericentrin) throughout the cell cycle. Endogenous proteins were detected with primary antibodies (Santa Cruz Biotechnology or Abcam), revealed with Alexa Fluor 488 or Alexa Fluor 546 (Molecular Probes Inc.) secondary antibodies, and visualized by confocal fluorescence microscopy using an Operetta High Content Imaging System (PerkinElmer). PCNT (Pericentrin) was used to stain the centrosome and TUBA (α-tubulin) to stain the microtubules and/or cytoskeleton. The nucleus was stained by Hoechst. The images were edited using Volocity Demo version 6.1.1 software (PerkinElmer). The specific cell cycle phases and scale bars are indicated. At least 25 cells were analyzed in each cell cycle phase from three independent experiments, and all cells showed the localization pattern represented in the images. Magnitude: 60X in panels D and G; 40X in the other images. Short arrows denote spindle midzone and pole, white long arrows denote cytoplasmic bridge, red long arrows indicate possible midbody, white arrowheads denote centrosome, and red arrowheads denote contractile ring localization.

