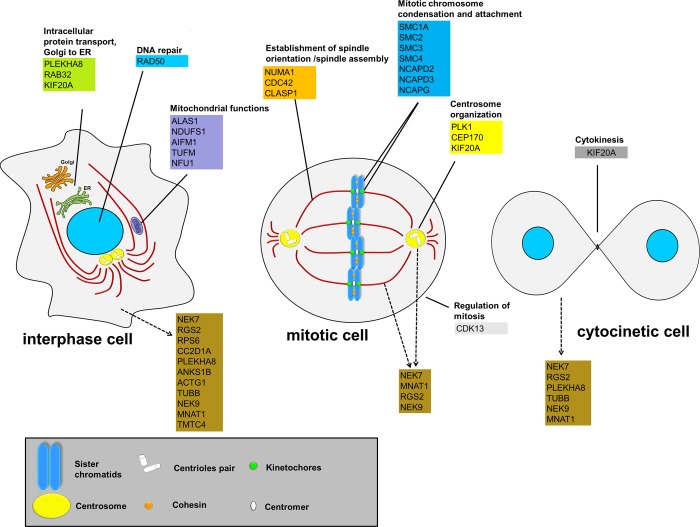
Figure 8.
Schematic representation of human NEK7 interactors throughout the cell cycle. The scheme depicts the components of NEK7 and its interactors throughout the cell cycle according to biological processes (filled line) and subcellular localization (dashed arrows). The subprocesses were manually classified according to the literature in combination with GO term analysis. See detailed legend for symbols at the bottom of the figure. ER: endoplasmic reticulum.

