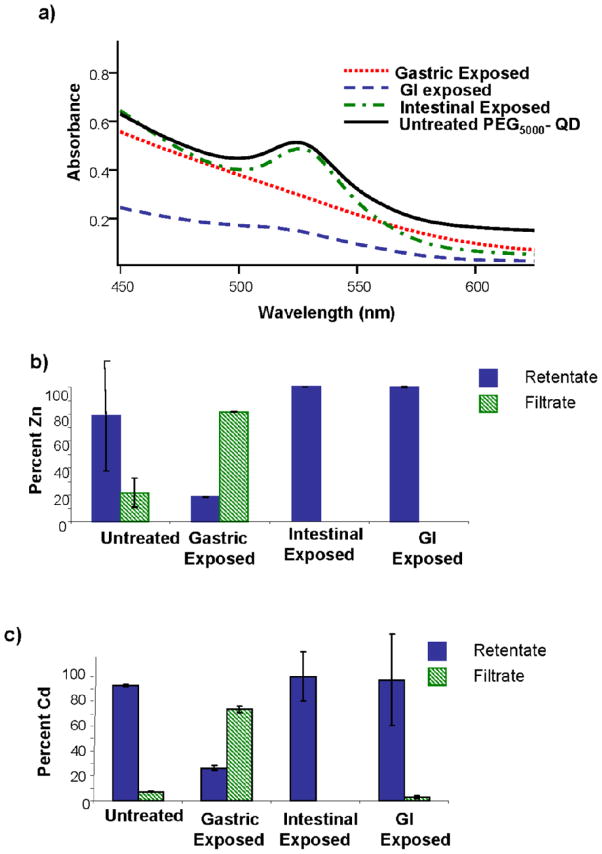
Figure 3.
(a) UV-Visible absorption spectra of PEG5000-QDs following exposure to gastric, intestinal or gastrointestinal fluid exposure. Percentages of (b) Zn and (c) Cd in the retentate and filtrate of PEG5000-coated QDs exposed to simulated digestive fluids. Following exposure, QDs were separated from solution by centrifugal filtration. Percentages were calculated relative to total recovered metal. Bars are means of triplicate samples; error bars represent one standard deviation.

