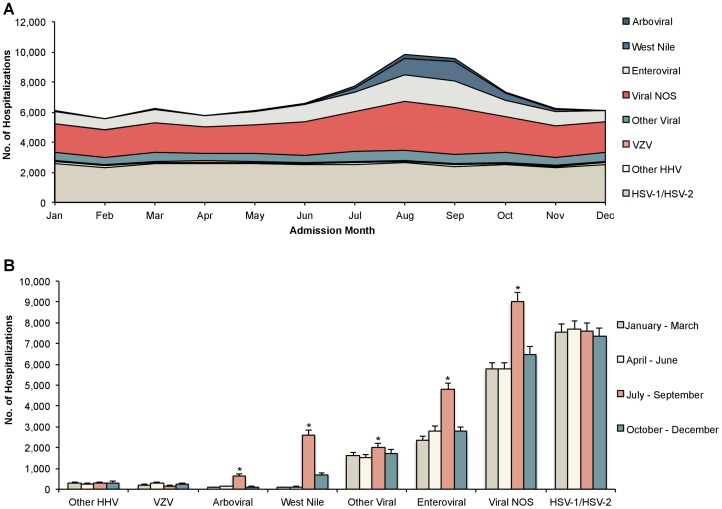
Figure 3. Seasonal variation of hospital admissions for viral encephalitis (A) by montha and (B) by seasonb (n = 83,225).
Abbreviations: NOS = not otherwise specified; VZV = Varicella Zoster Virus; HHV = Human Herpesvirus; HSV = Herpes Simplex Virus. a) Includes a stacked representation of all known viral and viral NOS hospital admissions for encephalitis from 2000 to 2010. For example, there was an estimated total of 9,827 viral and viral NOS admissions in the month of August over the entire 11-year period from 2000 to 2010, of which, 1,085 (11%) were due to West Nile Virus infection. Data on admission month was missing for 8.7% of encephalitis admissions. b) Significance: *P<.01 in both base case (2000–2010) and sensitivity analysis (2005–2010) using adjusted Wald test comparing each interval to January-March. Under the base case analysis, July-September for other viral causes and October-December for viral NOS causes were significant (P<.05); however, these were insignificant in the sensitivity analysis (P = .12 and P = .75, respectively).

