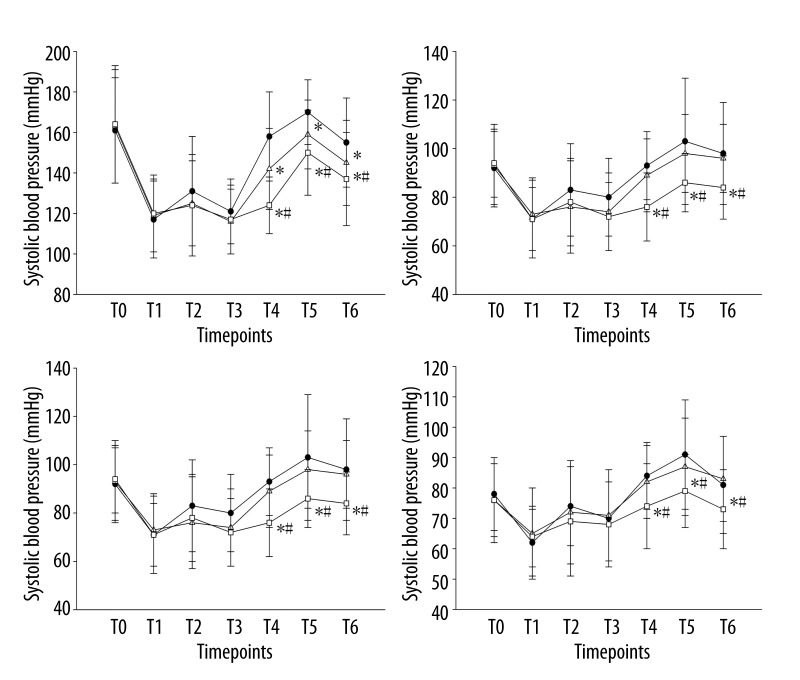
Figure 2.
Comparison of SBP, DBP, MAP, and HR in the 3 groups. The data are presented with mean ±SD. * P<0.05 compared with saline group. # P<0.05 compared with lidocaine group. There were no significant differences in SBP, DBP, MAP, and HR among the 3 groups from T0 to T3 (P>0.05 each). From T4 to T6, SBP, DBP, MAP, and HR were significantly lower in the lidocaine and ropivacaine groups than in the saline group (P<0.05 each) and were significantly lower in the ropivacaine group than in the lidocaine group (P<0.05 each).

