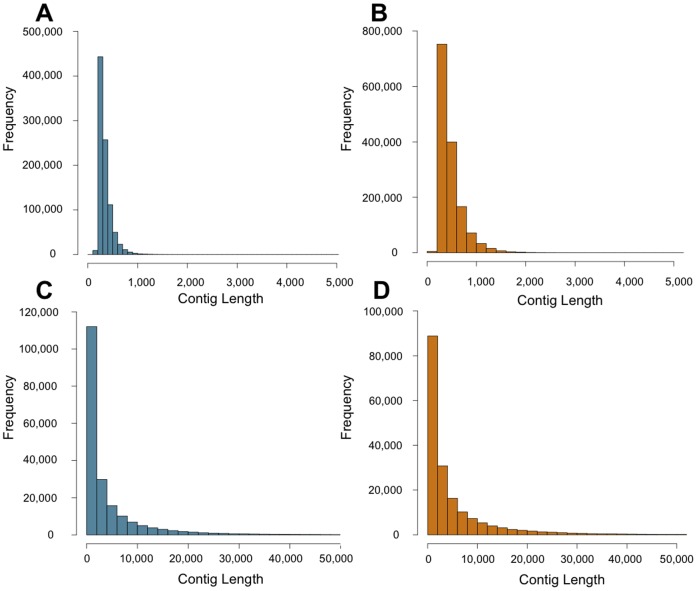
Figure 1. Genomic contig sizes based on various assembly strategies.
Frequency histograms of contig sizes for (A) the Sage-Grouse de novo assembly, (B) the Clark's Nutcracker de novo assembly, (C) the Sage-Grouse reference-guided assembly (1x read coverage) split at (N)500 motifs, and (D) the Clark's Nutcracker reference-guided assembly (1x read coverage) split at (N)500.

