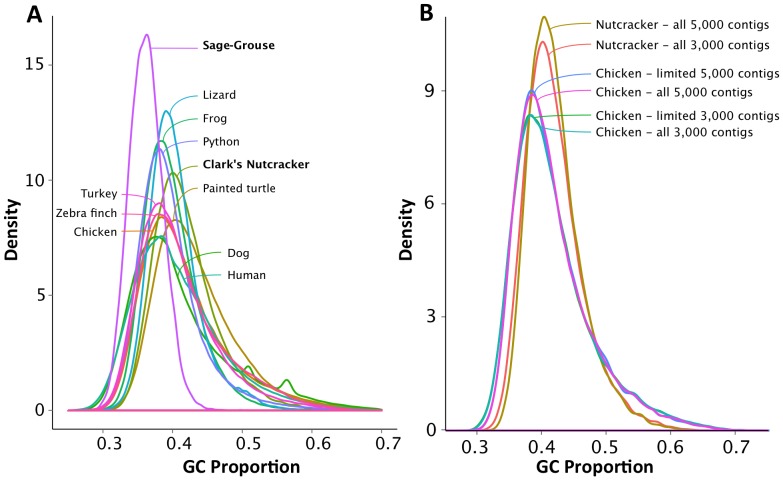
Figure 7. Genomic GC isochore structure among amniote vertebrates, and in draft genomes.
(A) GC isochore structure plot of 1x guided assemblies for both bird species, their reference genomes, and other select amniote vertebrate genomes using a 3 kb window size. (B) GC isochore structure plot comparison of 1x the Clark's Nutcracker guided assembly and the reference the Chicken genome. All contigs at both a 3,000 and a 5,000 bp window were used for the Clark's Nutcracker (n = 73,158 and n = 30,090 contigs respectively). All contigs (referred to as “all” in figure) or a random selection equal to the number of contigs in the Clark's Nutcracker assembly (“limited”) for both the 3,000 and 5,000 bp window were used in the comparison.

