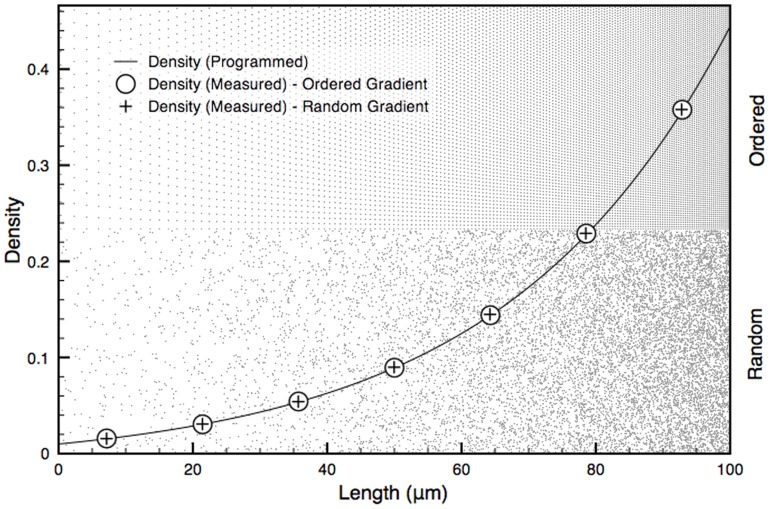
Figure 3. Ordered and random DNGs superposed with their programmed exponential density function and actual, measured density.
A 100×100 µm2 exponential (k = 3) DNG spanning from a density of 0.01 to 0.30 is shown in ordered (top half) and random (bottom half) form. The random DNG was programmed by subdividing it into 1 µm wide boxes with random seeding of nanodots and compensating for overlap. The measured density follows the programmed exponential curve with high fidelity for both ordered (R2 = 0.99996) and random (R2 = 0.99986) DNGs.

