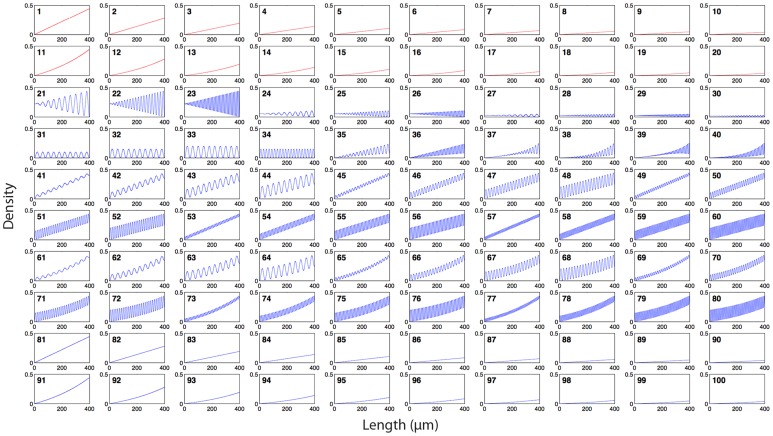
Figure 6. Density functions of the array of 100 DNGs.
Each box shows the density function of one gradient. Functions 1–20 were produced with the ordered gradient algorithm (red), and functions 21–100 were produced with the random gradient algorithm (blue). Functions 1–10 and 81–90 are linear. Functions 11–20 and 91–100 are exponential. Functions 21–34 are sinusoidal with no slope (controls), where 21–30 have linearly increasing amplitude and 31–34 have constant amplitude. Functions 35–36 feature a linear slope superposed with a sinusoid that has linearly increasing amplitude. Functions 37–40 feature an exponential slope superposed with a sinusoid that has exponentially increasing amplitude. Functions 41–60 have a constant slope superposed with a sinusoid of constant amplitude. Functions 61–80 are exponential slopes superposed with sinusoids of constant amplitude.

