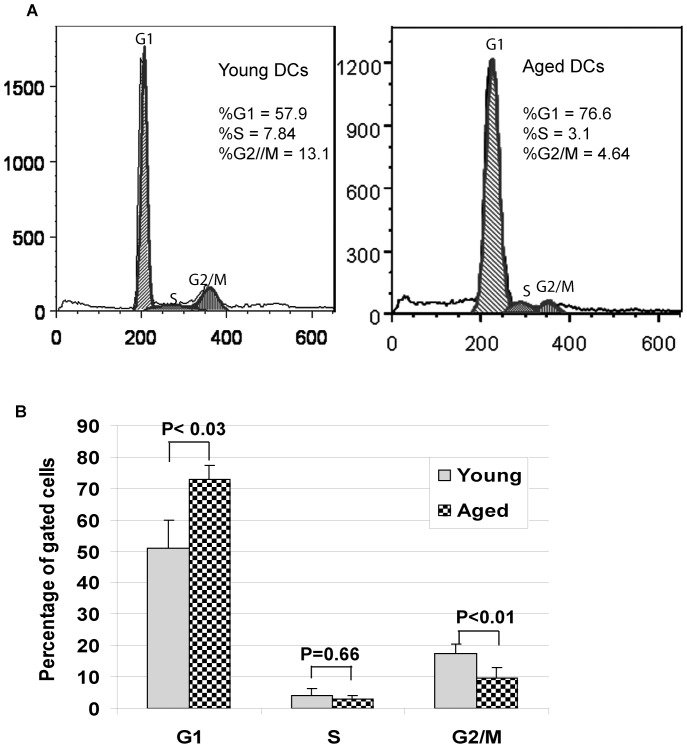
Figure 4. Cell cycle phases are different between MoDCs from aged and young donors.
(A) Distribution of aged and young MoDCs existing in the various phases of the cell cycle as determined by FACS. (B) Statistical analysis and percentages of MoDCs from young and aged donors in each phase of the cell cycle (n = 5, each group). Donors' information sees Table 2.

