
Figure 5. ROC analysis for the detection of M.tb culture-positive individuals by HIV Status.
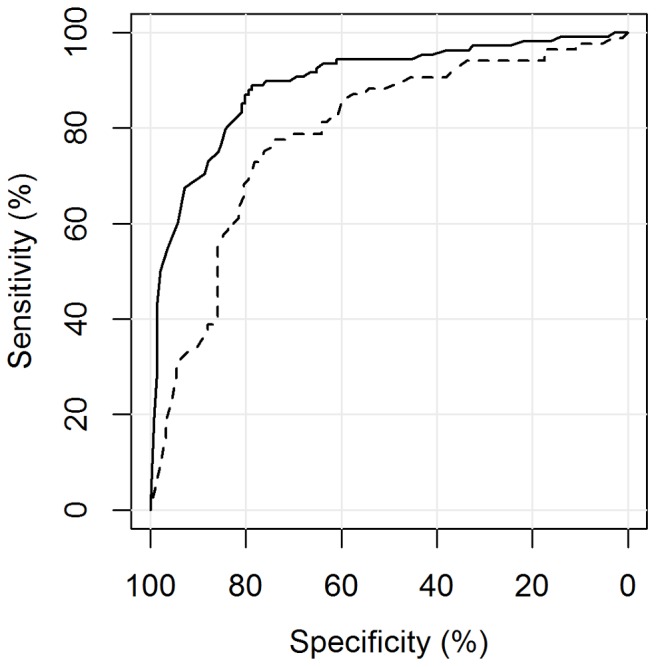
Legend. —– HIV negative. A (s+/c+ M.tb), B (s−/c+ M.tb) vs. F (Controls): Az = 0.89 (0.85–0.94), - - - HIV positive. A (s+/c+ M.tb), B (s−/c+ M.tb) vs. F (Controls): Az = 0.79 (0.72–0.86), p<0.01.