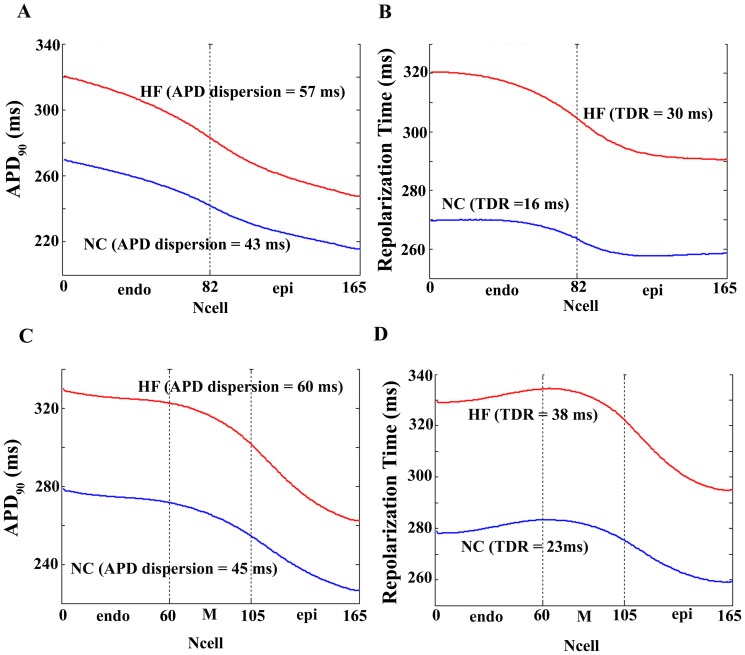
Figure 2. Action potential duration and repolarization time in normal and failing conditions including M cells influence.
Panels A and C. Action potential duration (APD90) measured along a transmural ventricular strand, in normal conditions (NC, blue line) and in heart failure conditions (HF, red line). APD dispersion is indicated in ms for each curve. Panels B and D. Repolarization time calculated along the ventricular strand in normal (blue line) and failing (red line) conditions. Transmural dispersion of repolarization (TDR) was measured in ms. The ventricular strands are composed by 82 endocardial and 83 epicardial cells (panels A and B) and by 60 endocardial, 45 M-, and 65 epicardial cells (panels C and D). All simulations were conducted using O'Hara et al. (ORd) action potential model [35].

