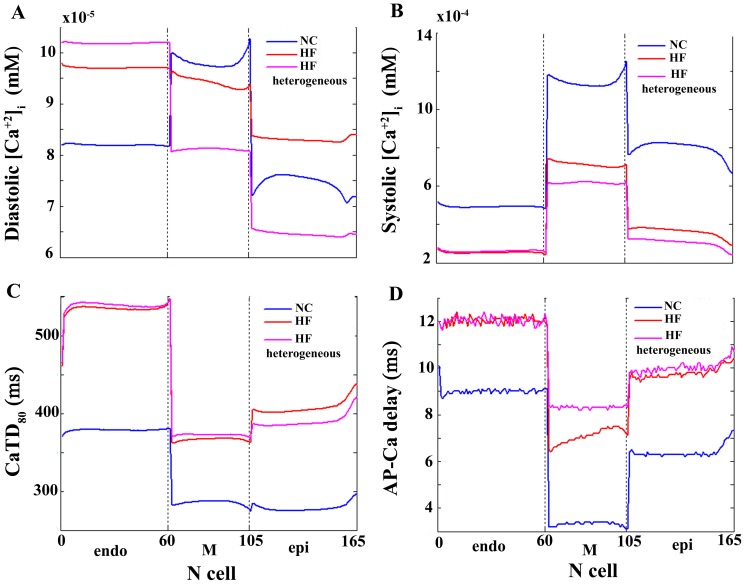
Figure 5. Calcium transient dynamics under normal and failing conditions.
Diastolic and systolic [Ca2+]i levels (panels A and B, respectively), Ca2+ transient duration (CaTD80) (panel C), and delay between AP and Ca2+ transient upstrokes (AP-Ca delay) (panel D) along a transmural ventricular strand under normal conditions (NC blue lines), homogeneous heart failure (HF) remodeling (red lines), and heterogeneous HF remodeling conditions (pink lines). Simulations were performed using O'Hara et al. model [35].

