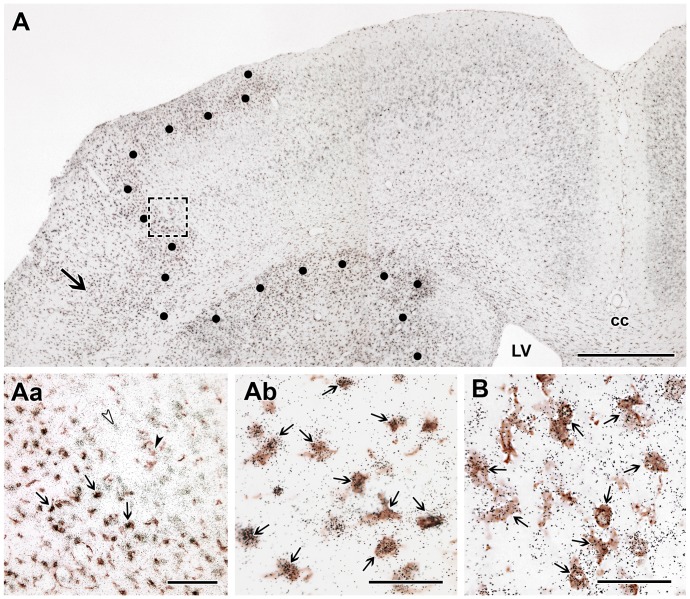
Figure 7. TGF-β RI and RII are induced in microglial cells.
Double labeling of TGF-β RI and RII mRNA and immunoreactivity of the microglia marker Iba1 at 72 h following MCAO. A: A low magnification picture of a section double labeled with TGF-β RI and Iba1. The border of the lesion is indicated by black dots. A rectangle and a large black arrow show the position of high magnification pictures in Aa and Ab, respectively. Aa: Single labeled TGF-β RI mRNA expressing neurons are indicated by white, and Iba1-immunoreactive microglia by black arrowheads in the intact cortex away from the lesion, respectively. In the penumbra, double labeled cells are found, some examples are shown by small black arrows. Ab: A high magnification picture shows that the black in situ hybridization signal of TGF-β RI is located above Iba1-imunoreactive cell bodies (brown precipitate) within the lesion. B: TGF-β RII is also expressed in microglia as demonstrated by double labeling of TGF-β RII mRNA (black in situ hybridization signal) and immunoreactivity of Iba1 (brown precipitate). TGF-β RII mRNA expressing microglias are indicated by black arrows. Abbreviations: cc - corpus callosum, LV - lateral ventricle. Scale bars: 1 mm for A, 100 µm for Aa and 50 µm for Ab and B.

