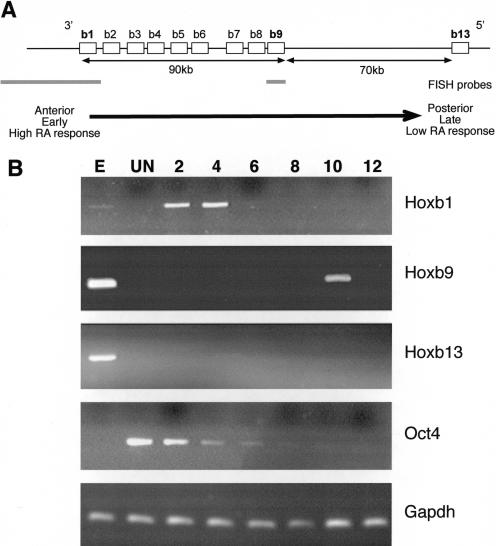
Figure 1.
Organization and differential activation of the Hoxb locus in ES cells. (A) Chromosomal organization of genes (open boxes) in the murine Hoxb complex. 5′ and 3′ indicate the direction of the transcription. The distance between genes is indicated below the map, as is the position of FISH probes (gray bars) for Hoxb1 and Hoxb9. The arrow indicates the colinear properties of the Hoxb cluster with respect to spatial expression (anterior to posterior), time of expression (early to late), and sensitivity to RA. Modified from Hunt and Krumlauf (1992). (B) Differential expression of Hoxb genes in OS25 ES cells. RT–PCR analysis of Hoxb1, 9, and 13 in undifferentiated (UN) cells and in cells induced to differentiate with RA for 2 to 12 d. Differentiation was confirmed by the loss of Oct4 expression. Total RNA from E11.5 embryo (E) and analysis of Gapdh were used as positive controls.

