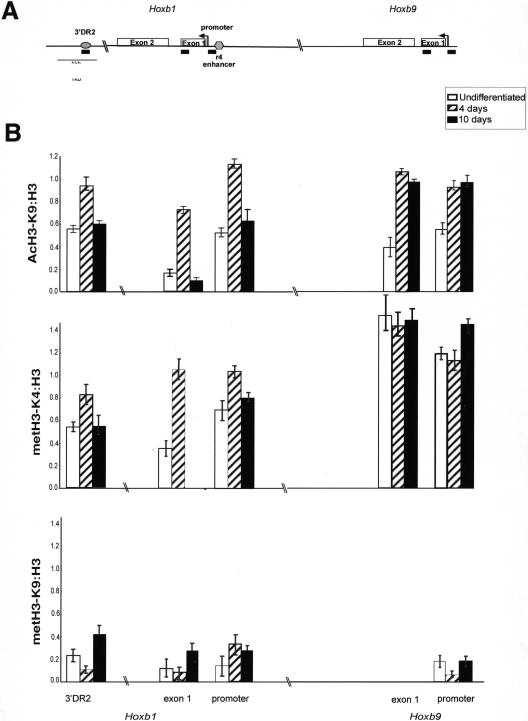
Figure 2.
Histone H3 modifications upon induction of HoxB in ES cells. (A) Map of Hoxb and the elements analysed by ChIP. Exons of Hoxb1 and Hoxb9 are represented by two open bars. The arrows denote the transcription start sites of Hoxb1 and Hoxb9. The 3′ RARE (3′DR2; Marshall et al. 1994) and the r4 enhancer (Popperl et al. 1995) are indicated by the filled bars. The position of the PCR products detected by ChIP are indicated by black bars underneath. (B) Quantification of ChIP by real-time PCR. The graphs show the mean levels of product amplified from samples after ChIP with antibodies recognizing AcH3-K9, met2H3-K4, and met2H3-K9 (after subtraction of mock IP levels) normalized relative to those obtained by ChIP with antibody recognizing the C terminus of H3. The analysis was carried out on chromatin prepared from undifferentiated ES cells (open bars) and from cells induced to differentiate with RA for 4 d (hatched bars) and 10 d (filled bars).

