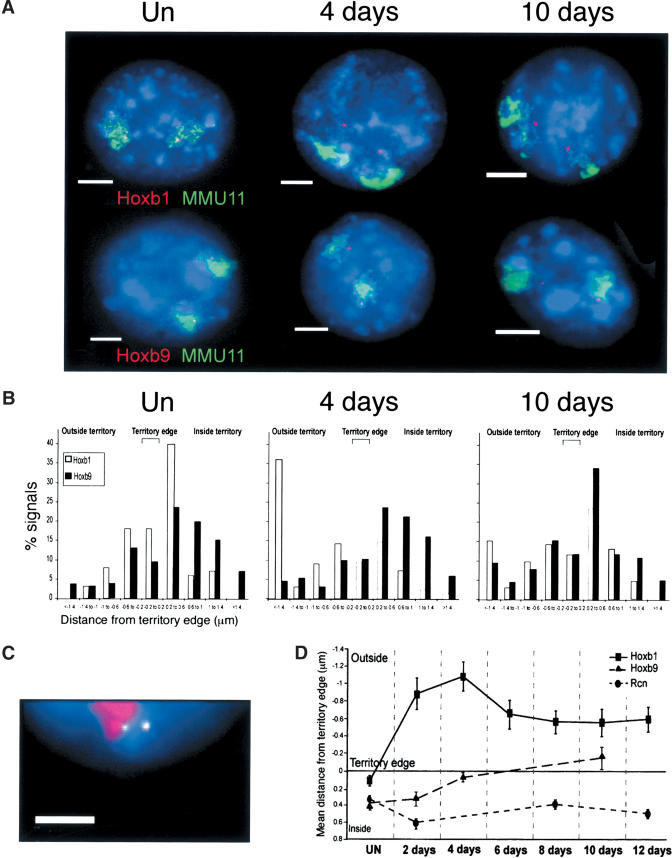
Figure 4.
Progressive looping of the HoxB cluster from 3′ to 5′. (A) FISH with MMU11 chromosome paint (green) and gene-specific probes (red) for Hoxb1 (top) or Hoxb9 (bottom) on MAA-fixed nuclei from undifferentiated (UN) cells, and from cells at 4 or 10 d of differentiation. Nuclei were counterstained with DAPI (blue). Bars, 5 μm. (B) Histograms showing the distribution of hybridization signals for Hoxb1 (open bars) or Hoxb9 (filled bars) relative to the MMU11 territory edge (μm). Negative distances indicate signals located beyond the visible limits of the detectable CT. n = 100 territories. (C) FISH with MMU11 chromosome paint (red) and gene-specific probes for Hoxb1 (green/red, 1:1) or Hoxb9 (green) on nuclei from cells at 10 d of differentiation. Nuclei were counter-stained with DAPI (blue). Bar, 5 μm. (D) Mean position (μm, ± S.E.M.) of Hoxb1 and Hoxb9 relative to the MMU11 territory edge during 12 d of differentiation. The position of Rcn in the MMU2 territory is shown as control (Mahy et al. 2002a). n = 100 territories. Normalization of the data to the size of the nucleus showed that the Hoxb movements are not due to the increased size of the nucleus and CT upon differentiation (data not shown).

