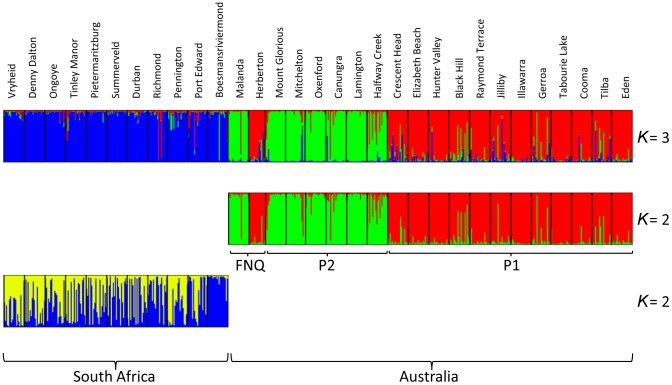
Figure 2. Results of structure analyses.
Graphical outputs of all structure analyses undertaken; all samples (top) showing K = 3 genetic clusters; Australia only (middle) showing K = 2 clusters; and South Africa only (bottom) showing K = 2 clusters. Sampling site names are listed above their respective outputs.

