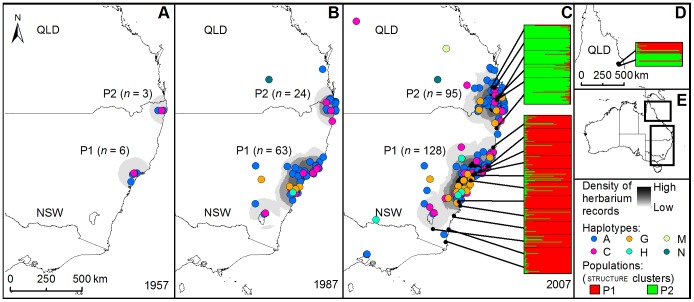
Figure 3. Maps illustrating the spread of Senecio madagascariensis in Australia through time.
Density of herbarium records and location of chloroplast haplotypes (A-C); location of P1 and P2 derived from nuclear microsatellite data from contemporary field collections (as defined by clusters in the program structure [44]) (C, D); clustering of sites in Far North Queensland with P1 and P2 (D); extent of maps in relation to Australia as a whole (E).

