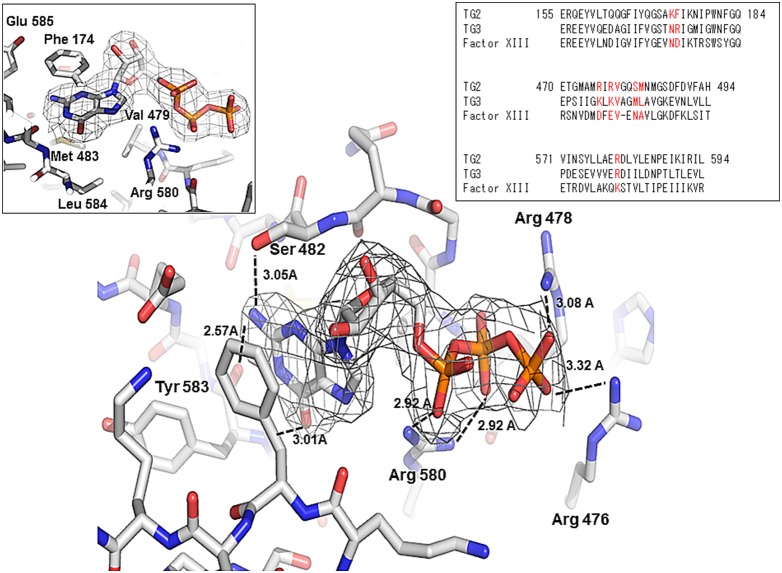
Figure 3. Environment of the GTP binding site in TG2.
An omit density map contoured at the 1-σ level around GTP. The residues involved in the GTP interaction are indicated. H-bonds are shown as black-dashed lines. The whole GTP binding site is shown in the left panel. Sequence alignment between TG2, TG3, and Factor XIII for sequence comparison of the GTP binding site is shown in the right panel.

