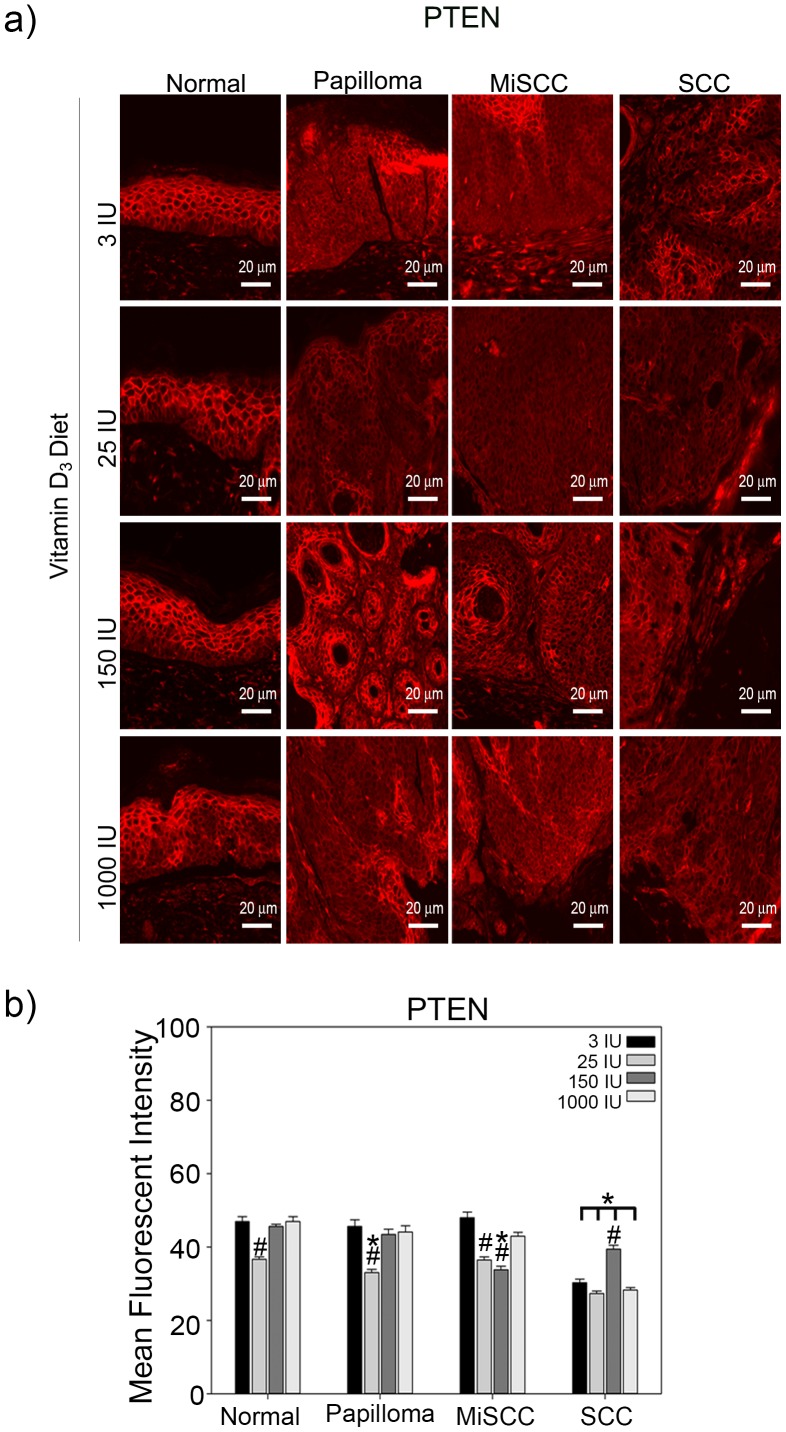
Figure 5. Effects of dietary Vitamin D3 on PTEN expression during tumor progression.
(a) Top panels show representative images taken at a 20x magnification, scale bar = 20 µm of normal skin, benign papillomas, MiSCC and SCC from mice fed diets of increasing concentrations of Vitamin D3 stained for PTEN. (b) Quantitation of PTEN levels from three animals per treatment condition is plotted. Y-axis represents the mean fluorescent intensity, normalized to background, in arbitrary units. Error bars represent s.e.m. * = p≤0.05 compared to normal skin from the same diet; # = p≤0.05 compared to tissue of same tumor grade from mice fed 3 IU Vitamin D3.

