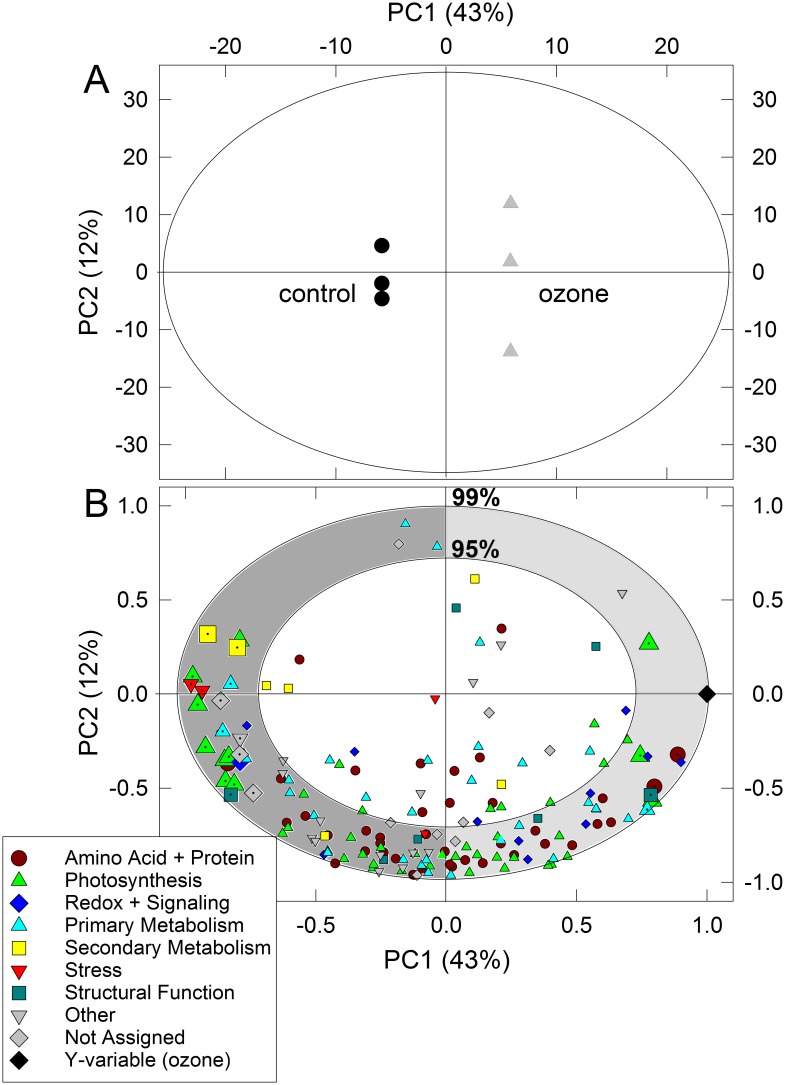
Figure 3. Two-dimensional (A) score and (B) scaled and centered loading plots of orthogonal partial least square regression (OPLS) of S-nitrosylated proteins (normalized by whole-cell extract) in poplar leaf samples determined using biotin switch assay and LC-MS/MS.
The explained variance (in percentage) and the number of principal components (PC) are reported in the x- and y-axes in both (A) and (B) plots. The ellipse in (A) indicates the tolerance based on Hotelling’s T2 with the significance level of 0.05. The outer and inner ellipses in (B) indicate 100% and 75% explained variance, respectively. (A) control = black circles, ozone-treated = grey triangles; (B) each functional group of proteins (according to Figure 1C) is indicated with different symbols, zoomed symbols with a dot represent the significantly different proteins between C and O plants tested independently with Student’s t-test (P<0.05 applying a FDR of 5%). Symbol legend: dark red circles = Amino acid metabolism and Protein synthesis, folding and degradation; blue diamonds = Redox and Signaling; cyan triangles-up = Primary metabolism; yellow square = Secondary metabolism; red triangles-down = Stress; dark green squares = Structural function; grey triangles-down = other; grey squares = not assigned or not identified. The black diamond indicates the Y-variable, i.e. ozone-treatment.

