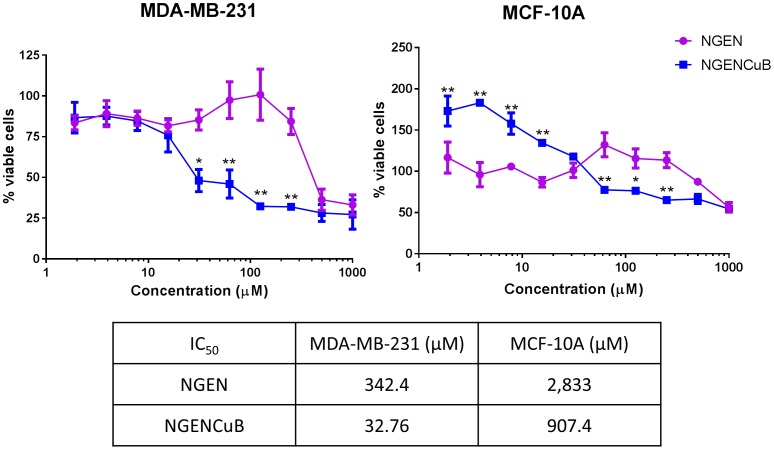
Figure 4. Effects naringenin (NGEN) or naringenin complexed with copper (II) and 2,2′-bipyridine (NGENCuB) on MDA-MB-231 (left) and MCF-10A (right) cell proliferation and IC50 values for each compound and cell line.
Cells were plated in a 96-well plate and incubated with different concentrations (1 to 1000 µM) of NGEN or NGENCuB for 48 hours. Viable cells were estimated by MTT assay. Results are expressed as percent viability relative to control (untreated) cells. Data represent mean ± SD of three independent assays in triplicate. Results were compared using ANOVA, followed by a Tukey's post-hoc analysis. Asterisks represent *p≤0.05, **p≤0.01, compared to NGEN.

