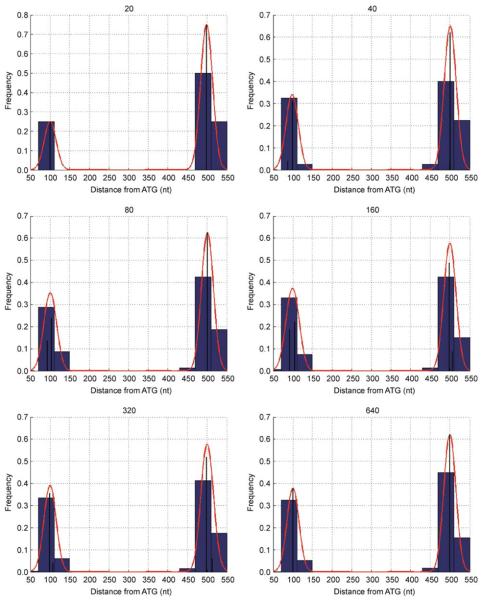
Figure 1. Simulated dataset with N = 20,40,80,160,320,640 ESTs attributed to two alternative TSS at positions 100 and 500 nucleotides upstream from the start of translation.
The blue histogram shows the distribution of EST positions, black lines correspond to the NPEST output, FML(θ), and red lines correspond to the smoothed distribution of TSS positions.

