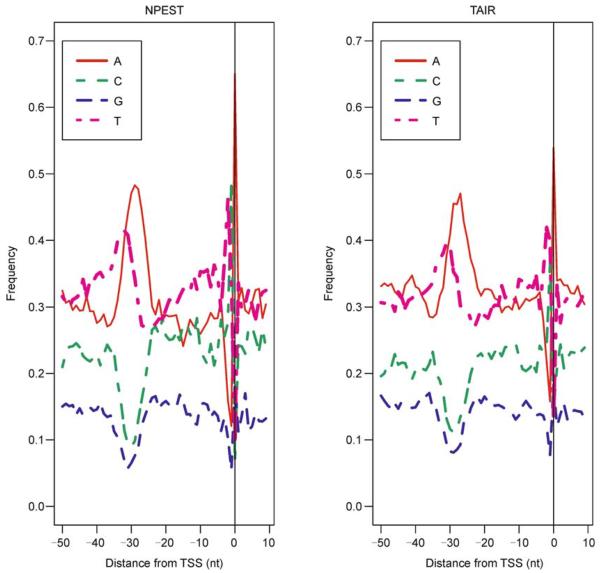
Figure 2. Comparison between NPEST (left) and TAIR (right).
Nucleotide consensus around the predicted TSS is more pronounced for the NPEST algorithm than for the TAIR annotations. There are 45% of T and 44% of C followed by 63% of A for NPEST and for TAIR: 43% of T and 35% of C followed by 53% of A.

