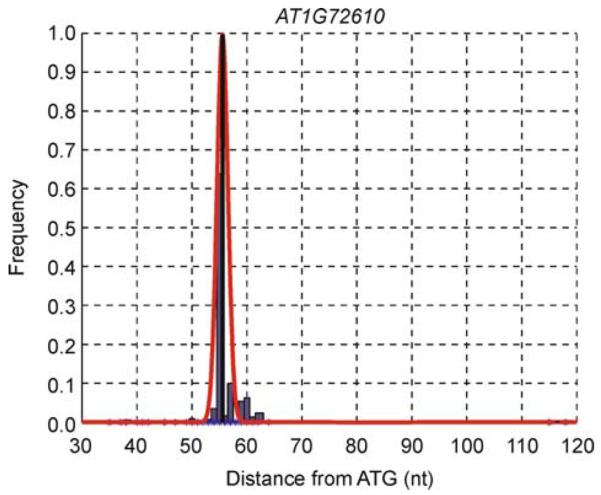
Figure 3. Example of the distribution of EST positions in an upstream region and NPEST prediction of TSS.

Histogram of the data is shown in blue, NPEST predictions are shown as black lines, and smoothed distributions are shown as red curves. There are 460 EST sequences mapped to the position −55, and 2 EST sequences are mapped to positions −115 nt and −117 upstream from the ATG.
