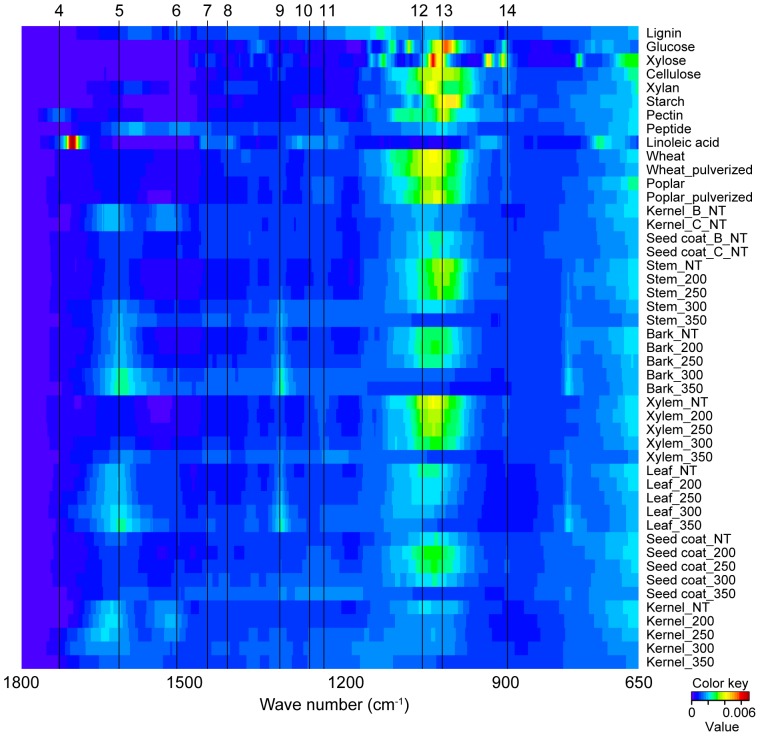
Figure 2. Heat-map like bird's eye viewing of FTIR spectra.
Horizontal axis shows wave number and vertical axis shows different samples, and signal intensity (arbitrary unit) are shown according to color key. Top nine samples in vertical axis are standard compounds such as lignin, sugars, peptide and fatty acid. NT, nontreatment. 200, 250, 250, 300 and 350 samples were torrefied at 200°C, 250°C, 300°C, and 350°C, respectively.

