
Figure 6. Mean stretch index (SI) and centroids' distance to goals' center (CdtG) and mini-goals line (CdtMG) of overloaded and underloaded teams across treatments and expertise groups.
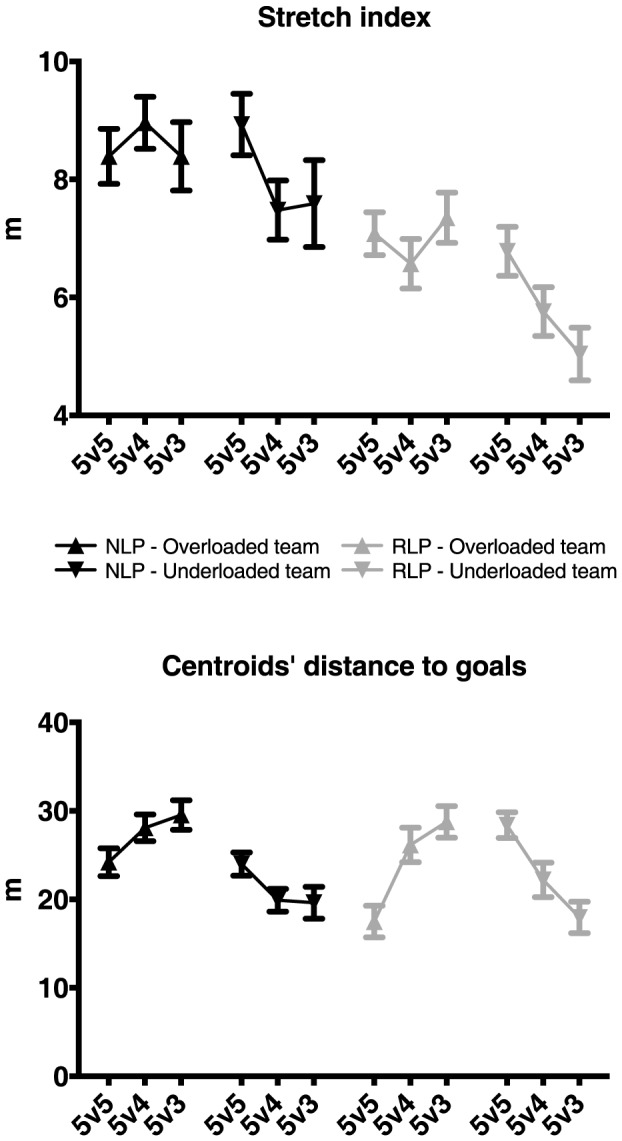
Error bars represent the standard error of the mean.
Official websites use .gov
A
.gov website belongs to an official
government organization in the United States.
Secure .gov websites use HTTPS
A lock (
) or https:// means you've safely
connected to the .gov website. Share sensitive
information only on official, secure websites.
Error bars represent the standard error of the mean.