
Figure 7. Mean distances between horizontal (upper panels – dtH1 and dtH2) and vertical lines (lower panels – dtV1 and dtV2) across treatments and expertise groups.
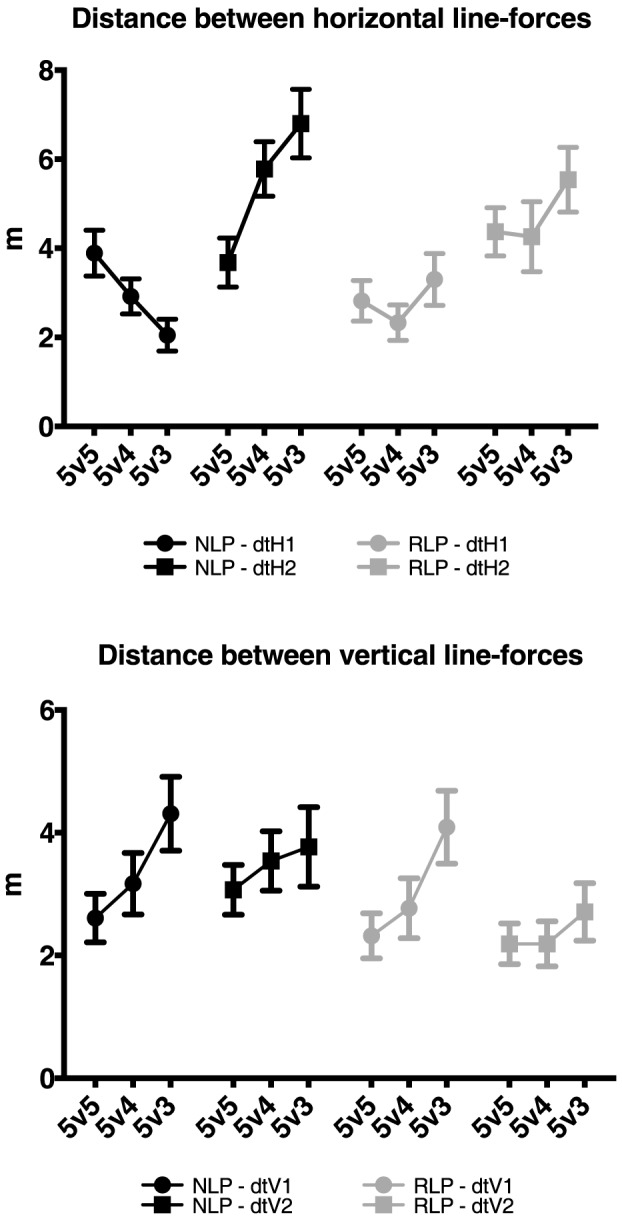
Error bars represent the standard error of the mean.
Official websites use .gov
A
.gov website belongs to an official
government organization in the United States.
Secure .gov websites use HTTPS
A lock (
) or https:// means you've safely
connected to the .gov website. Share sensitive
information only on official, secure websites.
Error bars represent the standard error of the mean.