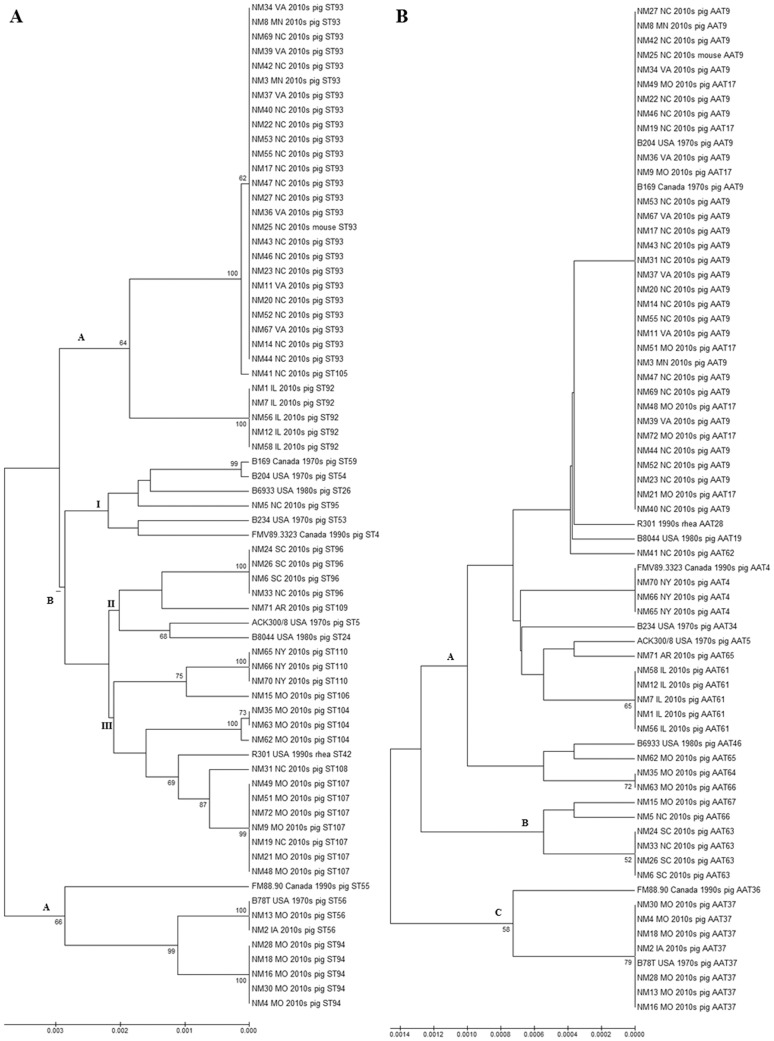
Figure 1. UPGMA depicting molecular relatedness of 69 North American (pre and post re-emergence) B. hyodysenteriae isolates.
A: Bootstrap consensus tree (1000 replicates) based on nucleotide sequences: The Tamura 3-parameter model of Unweighted Pair Group Method with Arithmetic Mean (UPGMA) was used to compute the genetic similarity of isolates using concatenated nucleotide sequences of the seven B. hyodysenteriae multi-locus sequence typing loci. Bootstrap values greater than 50% are shown at the nodes, and the total length of the scale represents 30 substitutions per 10,000 base pairs of nucleotide sequence. Isolate information includes details of the ST and the state (or country), decade and host species of origin. B: Bootstrap consensus tree (1000 replicates) based on amino acid sequences: The dendogram was constructed and depicted as mentioned in Figure 1A; however, here amino acid sequences (AATs) were the unit of analysis. The total length of the scale represents 14 substitutions per 10,000 amino acids sequence.

