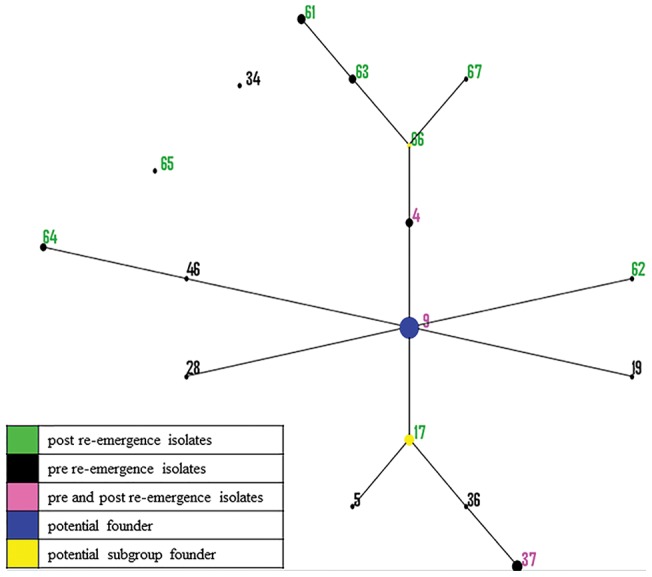
Figure 2. Population snapshot from 17 AATs of 69 North American isolates using the BURST algorithm.

In the Based Upon Related Sequence Types (BURST) algorithm of eBURST, the labeled dots represent the amino acid type (AAT), the size of the dot denotes the number of isolates represented by that AAT, and the solid lines between two dots indicate those which are single locus variants (SLVs) of each other. The position and the distance between the dots are arbitrary. AATs that represented isolates that were classified either as pre-, post- or both (pre- and post-) re-emergence were labelled in black, green or pink, respectively. Predicted primary founder types and subgroup founder types are denoted by blue and yellow dots respectively.
