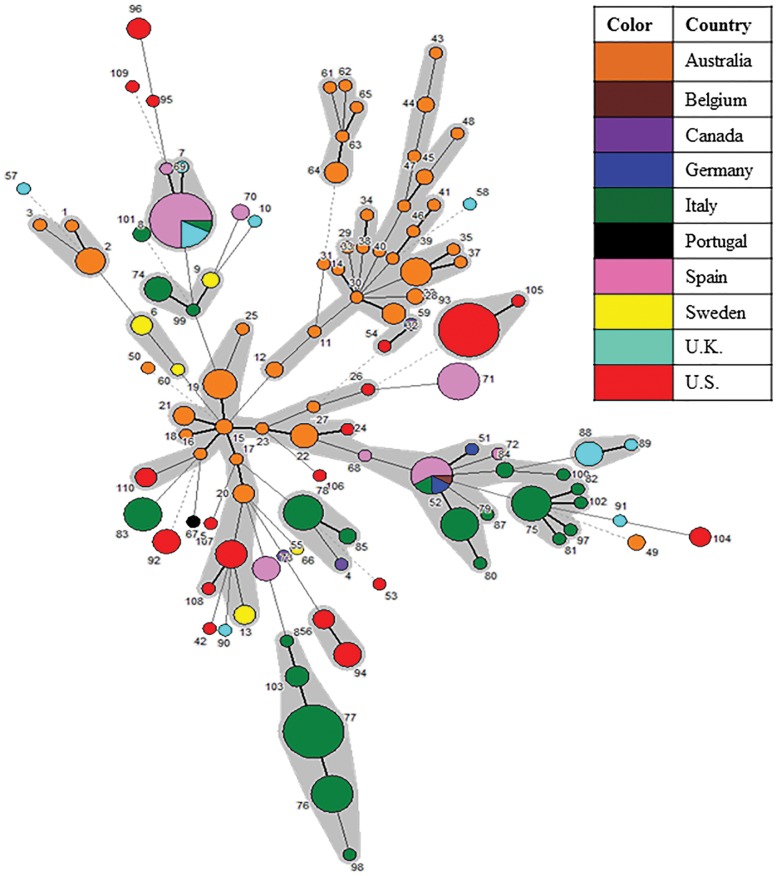
Figure 5. MST analysis of 110 STs representing 341 global B. hyodysenteriae isolates showing geographical distribution.
In the Minimum Spanning Tree (MST) analysis, each circle represents a different sequence type (ST) as labeled, its size reflects the number of isolates and the color indicates the country of origin. The width of the lines reflects the genetic difference between two STs, wherein dark/heavy lines connect single locus variants (SLVs), light/thin lines connect double locus variants (DLVs) and dotted lines indicate the most likely connection between two STs differing by three or more loci. STs which were DLVs of at least one other ST were grouped together (shaded in grey).

