
Figure 1. PCA of gene expression data.
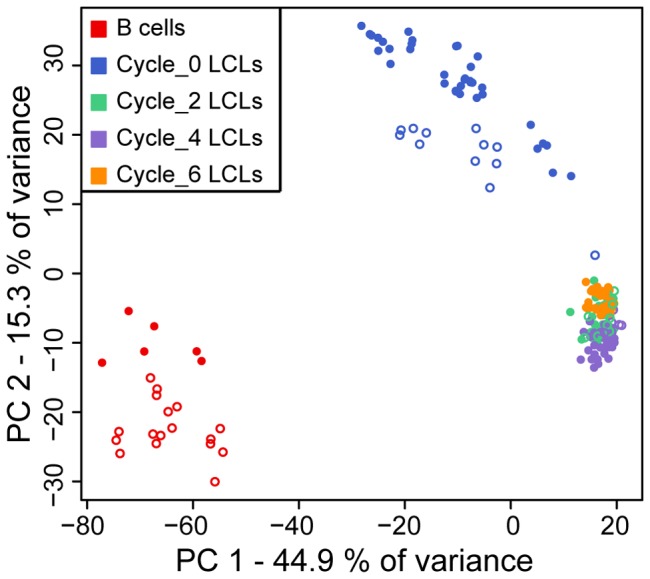
PCA was performed using pair-wise sample covariance matrix of 187 samples and applied to the genome-wide gene expression data (10,313 genes detected as expressed). Filled circles correspond to original hybridization and empty circles correspond to technical hybridization replicates (samples that were hybridized in more than one array batch).